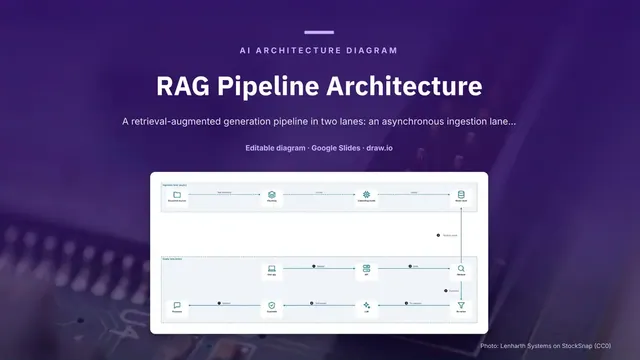
RAG Pipeline Architecture
Slides + PowerPoint5 slides
Free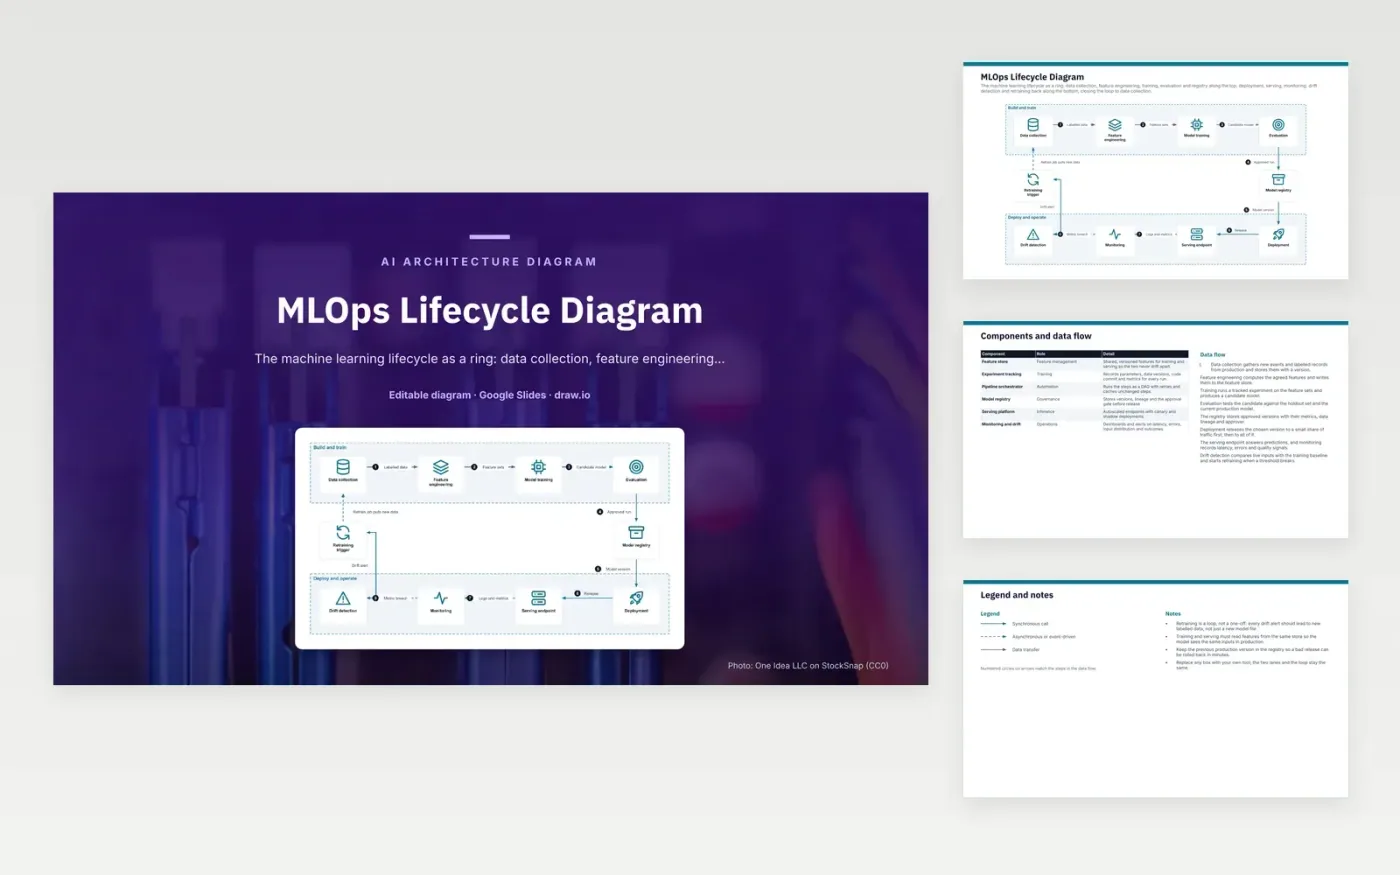
New events and labelled records are collected and versioned, then feature engineering writes the agreed features to a feature store. Training runs a tracked experiment on those feature sets and produces a candidate model. Evaluation tests the candidate against a holdout set and the current production model. The registry keeps approved versions with metrics, lineage and approver. Deployment releases the chosen version to a small share of traffic first. The serving endpoint answers predictions, and monitoring records latency, errors and quality signals.
The loop is the point of the design. Drift detection compares live inputs with the training baseline, and a threshold breach starts a retraining run that pulls new labelled data, so retraining is more than a new model file. Training and serving share one feature store, so live predictions use the inputs the model learned from. Keep the previous production version in the registry so a bad release can be rolled back in minutes. To adapt it, swap any box for your own tool and keep the loop.
Click Make a copy in Google Slides, then confirm on the Google page. The copy is saved to your own Google Drive.
Rename Data collection, Feature engineering, Model training and the other boxes inside Build and train to your own components, and delete the ones your system does not have.
Rewrite the 8-step data flow and the 6-row components table so they match the arrows you keep.
For the draw.io version, download mlops-lifecycle-diagram.drawio and open it at app.diagrams.net.
A feature store holds shared, versioned feature definitions for both training and serving. Using one source keeps the two in step, so a model does not see different inputs in production than it saw in training.
It compares the distribution of live inputs with the baseline used for training. A large gap suggests the data has changed and the model may need retraining. It does not by itself show that accuracy has fallen.
A canary sends a small share of traffic to the new version. Its results are checked against the current version before everyone is switched over, which limits the damage from a bad model.
More Google Slides templatesMore developer workflows templates
Slides + PowerPoint5 slides
Free
Slides + PowerPoint5 slides
Free
Slides + PowerPoint5 slides
Free
Slides + PowerPoint5 slides
Free
Slides + PowerPoint5 slides
Free
Slides + PowerPoint5 slides
Free
Slides + PowerPoint5 slides
Free
Slides + PowerPoint5 slides
Free
Slides + PowerPoint5 slides
Free
Slides + PowerPoint5 slides
Free
Slides + PowerPoint5 slides
Free