AWS Data Lake Architecture
Slides + PowerPoint5 slides
Free10 templates
Slides + PowerPoint5 slides
Free
Slides + PowerPoint5 slides
Free
Slides + PowerPoint5 slides
Free
Slides + PowerPoint5 slides
Free
Slides + PowerPoint5 slides
Free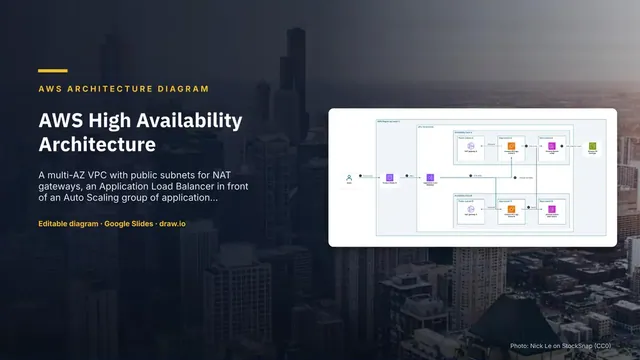
Slides + PowerPoint5 slides
Free
Slides + PowerPoint5 slides
Free
Slides + PowerPoint5 slides
Free
Slides + PowerPoint5 slides
Free
Slides + PowerPoint5 slides
Free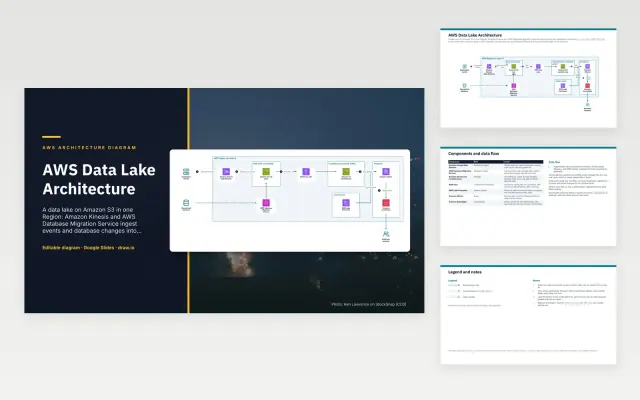 AWS Data Lake Architecture | 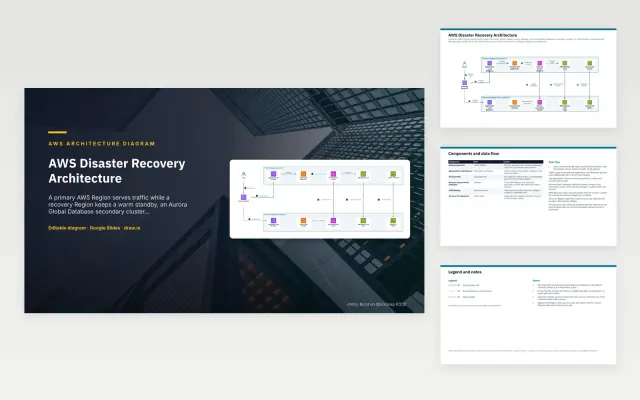 AWS Disaster Recovery Architecture | 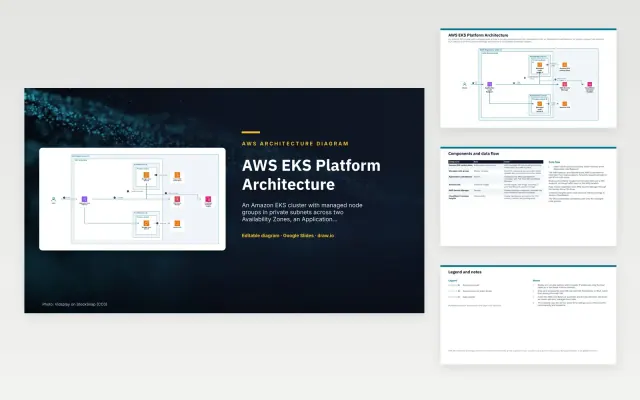 AWS EKS Platform Architecture | 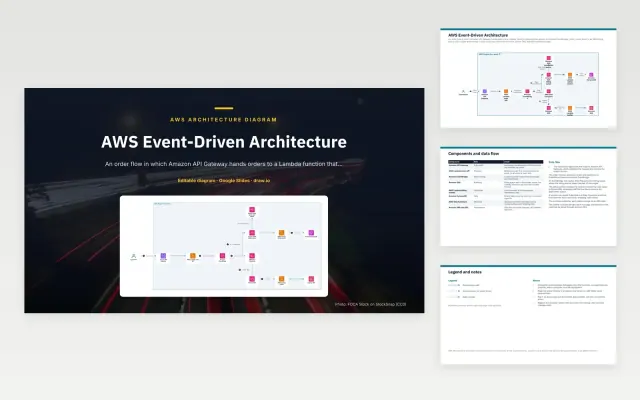 AWS Event-Driven Architecture | |
|---|---|---|---|---|
| Format | Presentation | Presentation | Presentation | Presentation |
| Works in | Google Slides and PowerPoint | Google Slides and PowerPoint | Google Slides and PowerPoint | Google Slides and PowerPoint |
| Length | 5 slides | 5 slides | 5 slides | 5 slides |
| Style | Not listed | Not listed | Not listed | Not listed |
An AWS architecture diagram shows how a workload is built on Amazon Web Services: the Region, VPC, Availability Zones and subnets, the services inside them and how requests and data flow. It is used for design reviews, Well-Architected reviews, cost and security discussions and handover to operations.
Cover the Region, VPC and Availability Zones as containers, public and private subnets, the AWS services, each with its official icon and name, users and external systems outside the Region, the request and data flow as numbered arrows, and notes on scaling, backup and failover.
Put the boundaries in first (Region, VPC, Availability Zones, subnets), then place services inside them. Where a service sits tells the reader most of what they need to know about its exposure and resilience.
Compare AWS Data Lake Architecture, AWS Disaster Recovery Architecture, and AWS EKS Platform Architecture, all 5 pages long, then pick the closest match and replace the sample text with your own.
An AWS architecture diagram shows how a workload is built on Amazon Web Services: the Region, VPC, Availability Zones and subnets, the services inside them and how requests and data flow. It is used for design reviews, Well-Architected reviews, cost and security discussions and handover to operations.
Include the Region, VPC and Availability Zones as containers, public and private subnets, the AWS services, each with its official icon and name, users and external systems outside the Region, the request and data flow as numbered arrows, and notes on scaling, backup and failover. Put the boundaries in first (Region, VPC, Availability Zones, subnets), then place services inside them. Where a service sits tells the reader most of what they need to know about its exposure and resilience.
AWS publishes its architecture icons for customers and partners to create architecture diagrams. Keep each icon unchanged and label it with the service name. AWS is a trademark of Amazon.com, Inc. or its affiliates; these templates are not affiliated with AWS.
Draw at least two Availability Zones side by side with matching subnets and resources, and show the load balancer and the database replica or standby spanning them.
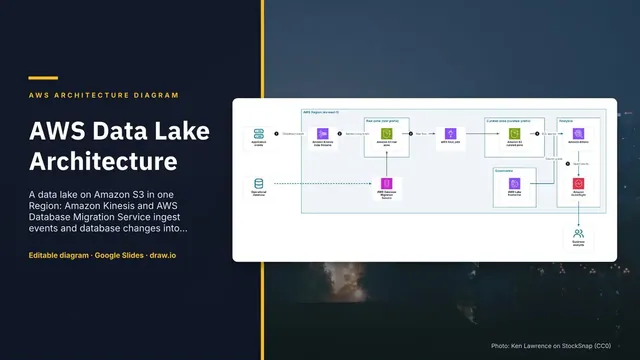
Start with AWS Data Lake Architecture: A data lake on Amazon S3 where Kinesis and Database Migration Service load a raw zone, Glue writes a curated zone, and Lake Formation controls what Athena and QuickSight can read. If that is not the right fit, compare it with AWS Disaster Recovery Architecture.
The templates here are 5 pages long. Cut any section you do not need; each template explains what its sections are for.
Yes. These aws architecture diagram templates work in Google Slides and Microsoft PowerPoint. All 10 templates are free, with no account or email needed.