Market Research Report
Docs + Word6 pages
Free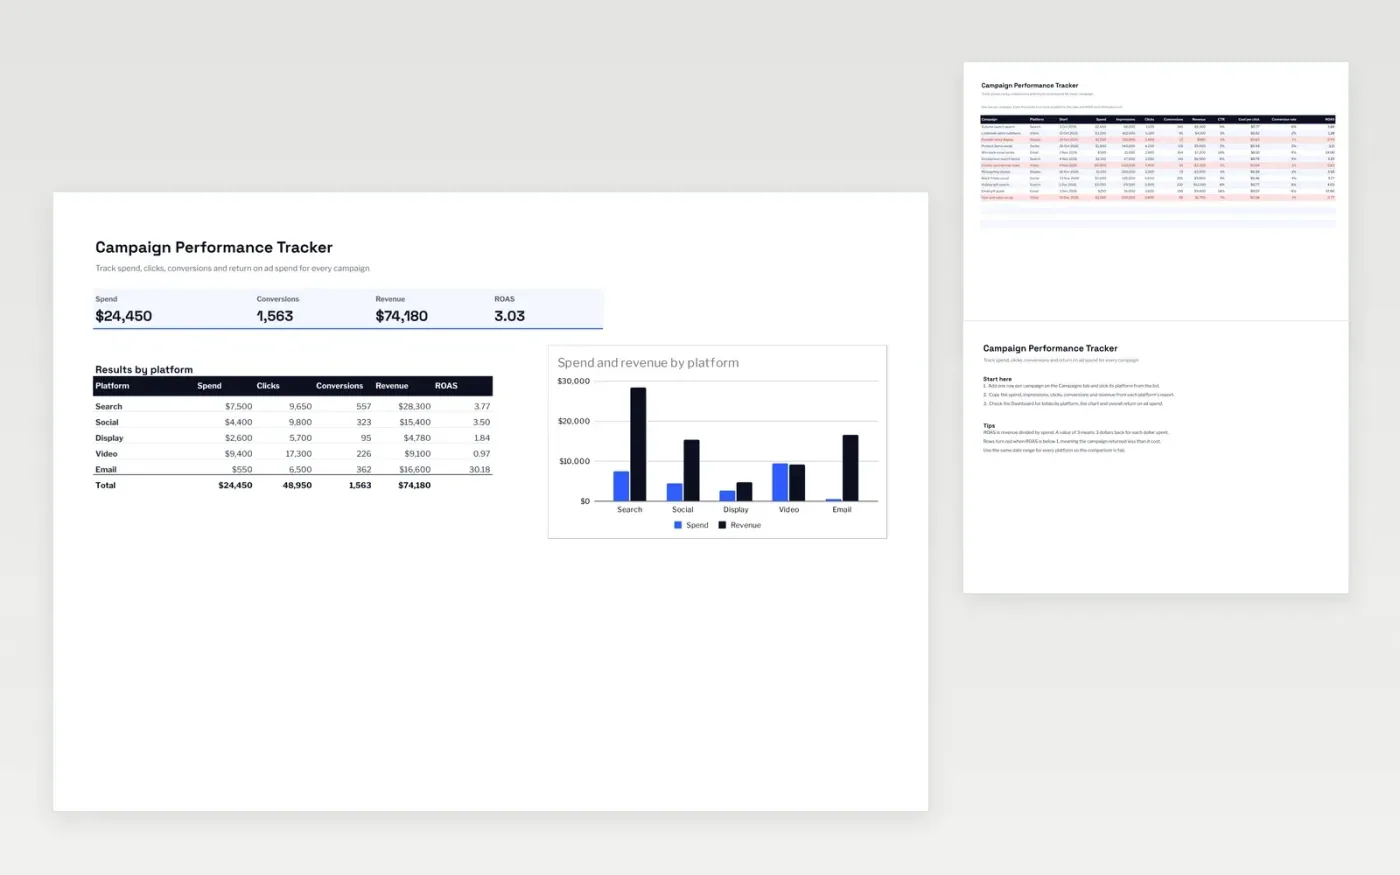
A results sheet for marketers who run adverts and promotions on several platforms. The Campaigns tab holds one row per campaign with its spend, impressions, clicks, conversions and revenue. Click-through rate, cost per click, conversion rate and return on ad spend are worked out for you. The Dashboard totals results by platform and charts spend against revenue.
The template comes with sample campaigns so you can see how it works. Make a copy, then replace the sample rows with your own figures. Formulas, the dashboard and the chart update on their own as you add rows.
Click Make a copy in Google Sheets, then confirm on the Google page. The copy is saved to your own Google Drive.
Start on the Campaigns tab: replace the sample rows with your own.
Keep the formula columns as they are; they fill in as you type.
Read the How to use tab for tips. For Excel, download the .xlsx file instead.
Yes. Download the template and make a copy for your own use at no cost.
Yes. Download the .xlsx file from this page and open it in Microsoft Excel. The tabs, formulas, dropdowns and charts all work there.
ROAS stands for return on ad spend. It is revenue divided by spend, so a value of 3 means 3 dollars back for each dollar spent. Campaigns below 1 are highlighted in red.
Docs + Word6 pages
Free
Google Sheets
Free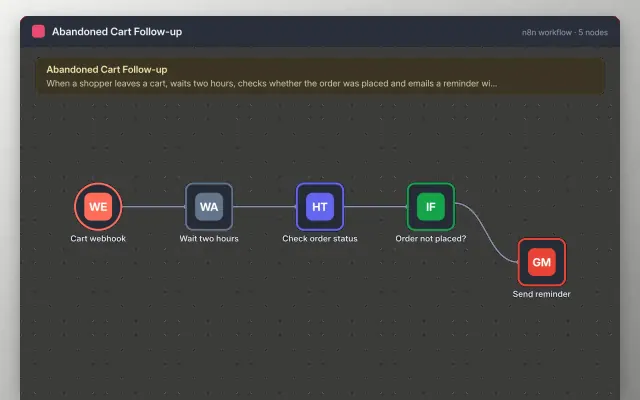
n8n
Free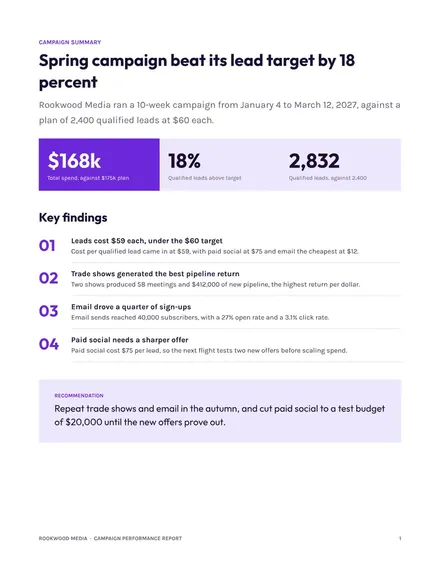
Docs + Word7 pages
Free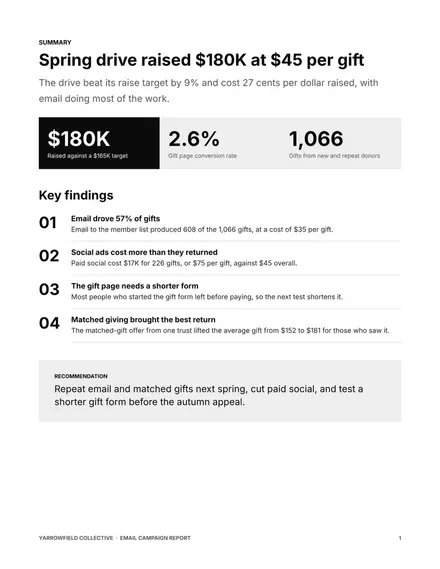
Docs + Word8 pages
Free
Slides + PowerPoint11 slides
Free
Slides + PowerPoint12 slides
Free