Annual Report
Docs + Word6 pages
FeaturedFree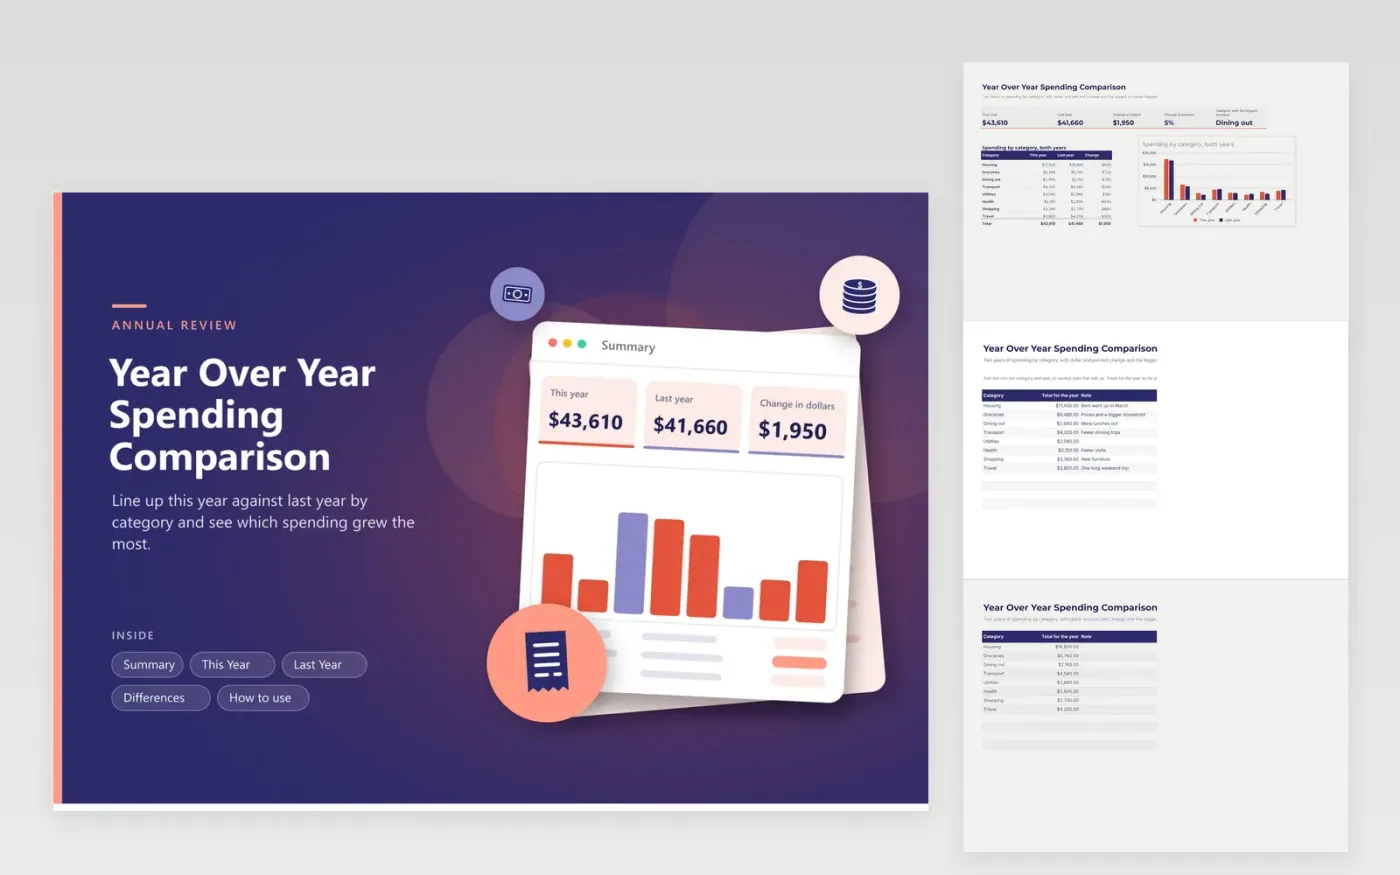
At year end most people know the total they spent and little else. This comparison lines up two years by category. One tab holds this year, one tab holds last year, and the Differences tab shows the change in dollars and percent for each category, with the biggest increase marked in red and the biggest drop in green.
The Summary adds up both years, shows the change and charts the categories side by side. Notes on each row record the reason, such as a rent increase or a long trip, so the numbers still make sense next January. Sample figures describe a household with rising groceries and dining costs and falling health spending. Replace them with your own totals from bank or card statements.
Click Make a copy in Google Sheets, then confirm on the Google page. The copy is saved to your own Google Drive.
Start on the This Year tab: replace the sample rows with your own.
Keep the formula columns as they are; they fill in as you type.
Read the How to use tab for tips. For Excel, download the .xlsx file instead.
Total each category for both years, then subtract. This sheet does that and also shows the percent change, so a small category with a big jump stands out.
Yes, but compare against the same months of last year. Otherwise every category looks lower simply because the year is not over.
Biggest increase and Biggest drop mark the categories with the largest dollar change up or down. Other rows show Up, Down or Same.
Docs + Word6 pages
FeaturedFree
Excel
FeaturedFree
Sheets + Excel5 tabs
Free
Sheets + Excel6 tabs
Free
Sheets + Excel7 tabs
Free
Sheets + Excel5 tabs
Free
Sheets + Excel5 tabs
Free
Sheets + Excel5 tabs
Free
Sheets + Excel4 tabs
Free
Sheets + Excel5 tabs
Free
Sheets + Excel5 tabs
Free
Sheets + Excel5 tabs
Free
Sheets + Excel5 tabs
Free
Sheets + Excel4 tabs
Free
Sheets + Excel4 tabs
Free