Annual Report
Docs + Word6 pages
FeaturedFree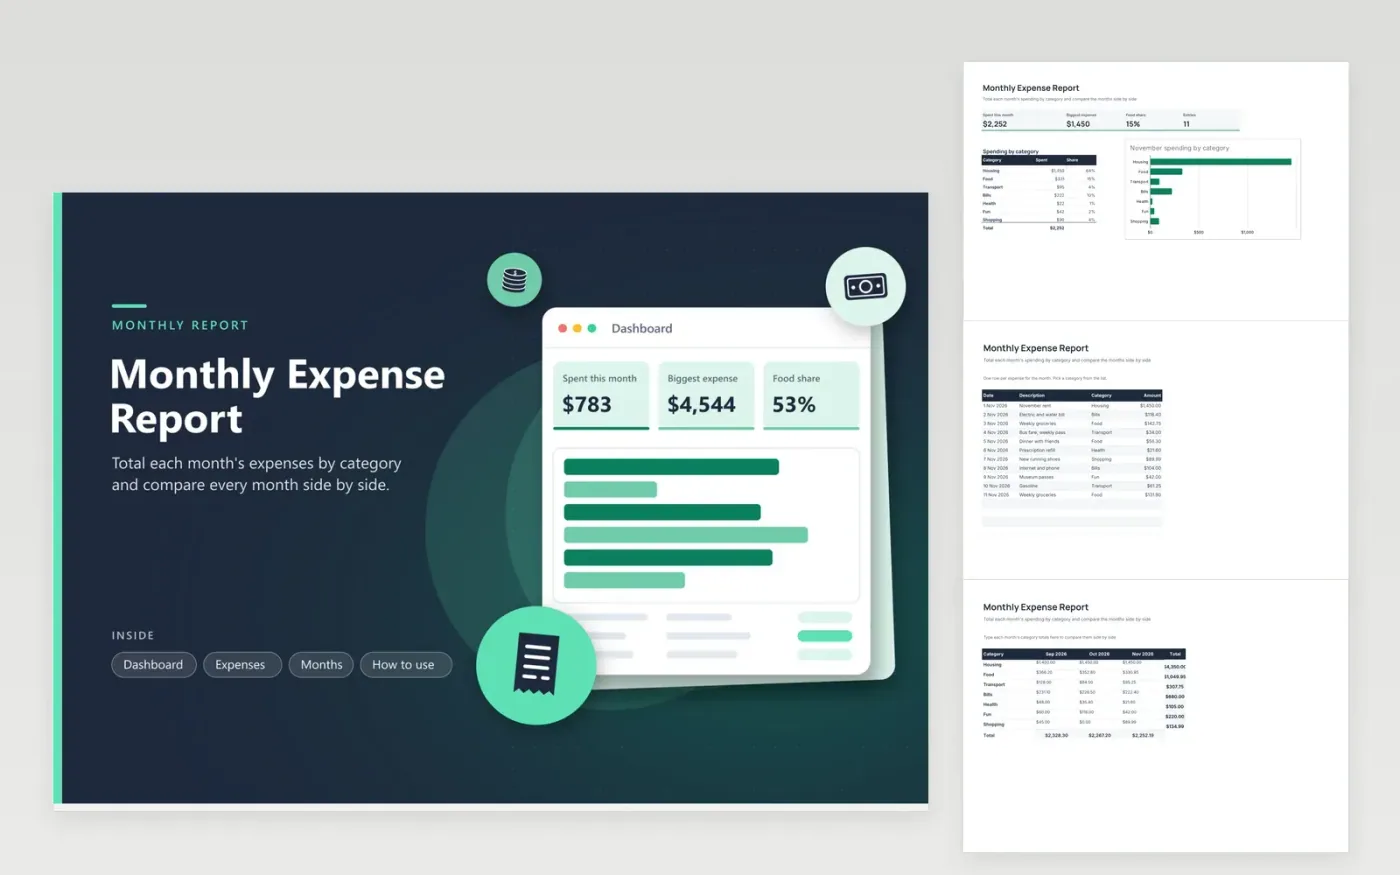
This report is for people who review their spending once a month and want to compare it with the months before. The Expenses tab lists each November purchase with its date, description, category and amount. The Dashboard totals the month, names the largest expense and shows each category's share in a bar chart. The Months tab is a grid of categories against September, October and November, with totals for each row and column.
Replace the sample entries with your own, then type the category totals for each earlier month into the grid. The grid holds figures you enter, so it does not change when the Expenses tab does. Copy each category's Spent figure from the Dashboard into the matching row at month end, and check the category names match the list on the Expenses tab.
Click Make a copy in Google Sheets, then confirm on the Google page. The copy is saved to your own Google Drive.
Start on the Expenses tab: replace the sample rows with your own.
Keep the formula columns as they are; they fill in as you type.
Read the How to use tab for tips. For Excel, download the .xlsx file instead.
Add a column to the right of the last month on the Months tab and type its name in the header. Then enter the category totals for that month. The totals row and column add up automatically, so nothing else needs changing.
The Dashboard only counts the rows on the Expenses tab, which holds the current month. The Months tab keeps the figures you typed for each month, so it can show a different total. Compare the two after you finish a month.
Yes. Make a column for each month, from January to December, and fill it in as each month closes. Use the totals row to see the year in one figure, and the largest category will stand out quickly.
Docs + Word6 pages
FeaturedFree
Excel
FeaturedFree
Sheets + Excel9 tabs
Free
Sheets + Excel5 tabs
Free
Sheets + Excel5 tabs
Free
Sheets + Excel4 tabs
Free
Sheets + Excel5 tabs
Free
Sheets + Excel5 tabs
Free
Sheets + Excel5 tabs
Free
Sheets + Excel4 tabs
Free
Sheets + Excel4 tabs
Free
Sheets + Excel5 tabs
Free
Sheets + Excel3 tabs
Free
Sheets + Excel3 tabs
Free
Sheets + Excel3 tabs
Free