Annual Report
Docs + Word6 pages
FeaturedFree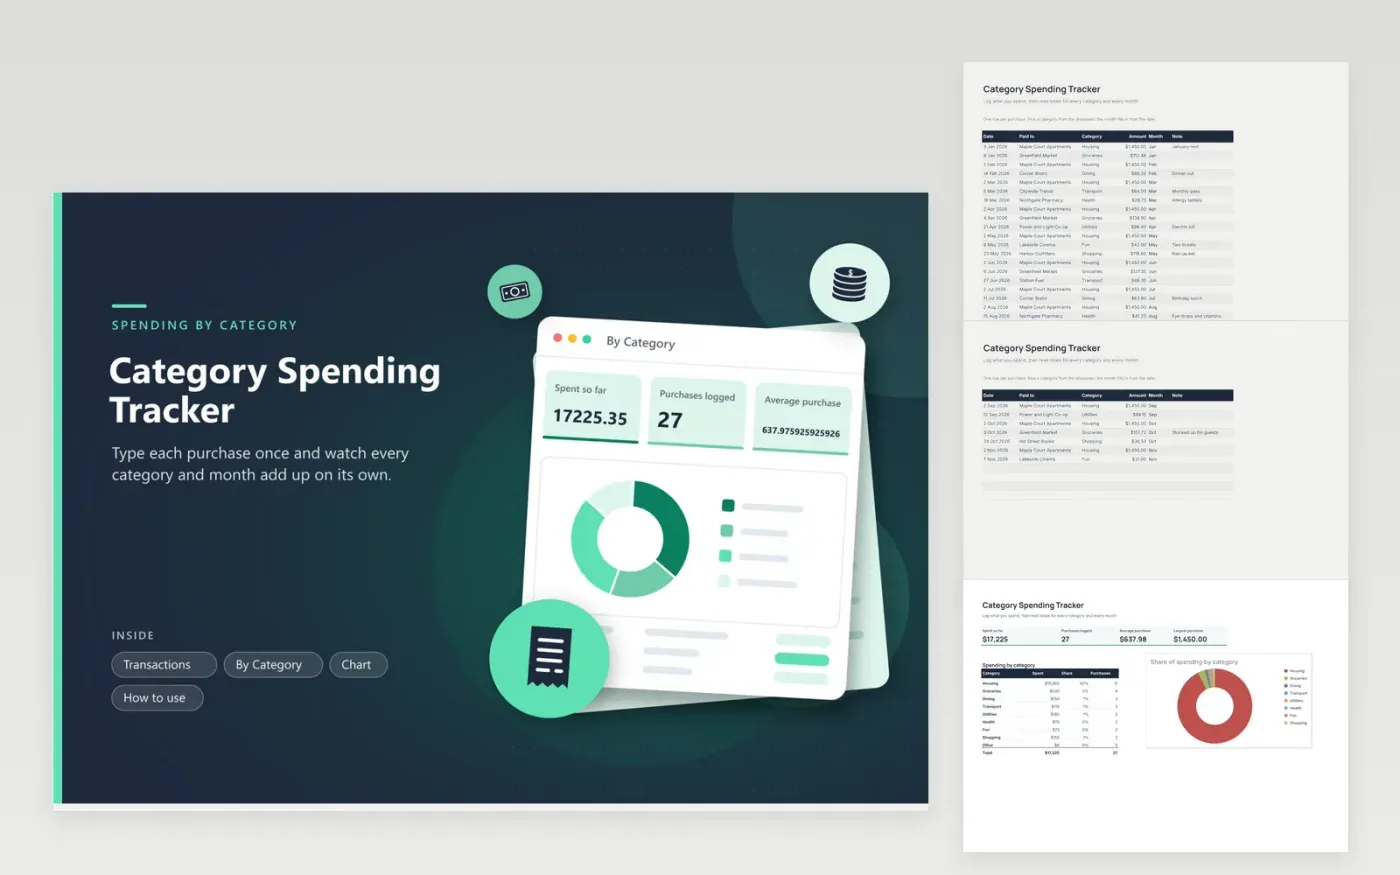
This category spending tracker suits people who write purchases down instead of linking a bank. The Transactions tab takes a date, the place you paid, a category and an amount; the month is read from the date. The By Category tab totals each of nine categories, shows its share of everything spent and counts the purchases behind it, and draws a doughnut chart of the shares. The Chart tab turns the same rows into a column chart for January through December.
Twenty-seven sample purchases from January to November show how it looks with real use, so swap them for your own. Pick a category from the dropdown each time, because a category typed another way will not reach its total. Keep adding rows beneath the table through the year, because the summary figures read the whole column.
Click Make a copy in Google Sheets, then confirm on the Google page. The copy is saved to your own Google Drive.
Start on the Transactions tab: replace the sample rows with your own.
Keep the formula columns as they are; they fill in as you type.
Read the How to use tab for tips. For Excel, download the .xlsx file instead.
Give every purchase one row with a date, an amount and a category from a fixed list. A SUMIFS formula then adds each category. This tracker does that for you and draws a doughnut chart.
Between six and ten is enough for most households. Too many categories make logging a chore, and too few hide where money goes. This sheet starts with nine, and you can rename them.
Yes. The month column fills in from each purchase date, and the Chart tab adds up every month from January to December in a column chart.
Docs + Word6 pages
FeaturedFree
Excel
FeaturedFree
Sheets + Excel5 tabs
Free
Sheets + Excel7 tabs
Free
Sheets + Excel5 tabs
Free
Sheets + Excel6 tabs
Free
Sheets + Excel5 tabs
Free
Sheets + Excel5 tabs
Free
Sheets + Excel4 tabs
Free
Sheets + Excel5 tabs
Free
Sheets + Excel5 tabs
Free
Sheets + Excel5 tabs
Free
Sheets + Excel5 tabs
Free
Sheets + Excel4 tabs
Free
Sheets + Excel4 tabs
Free