Annual Report
Docs + Word6 pages
FeaturedFree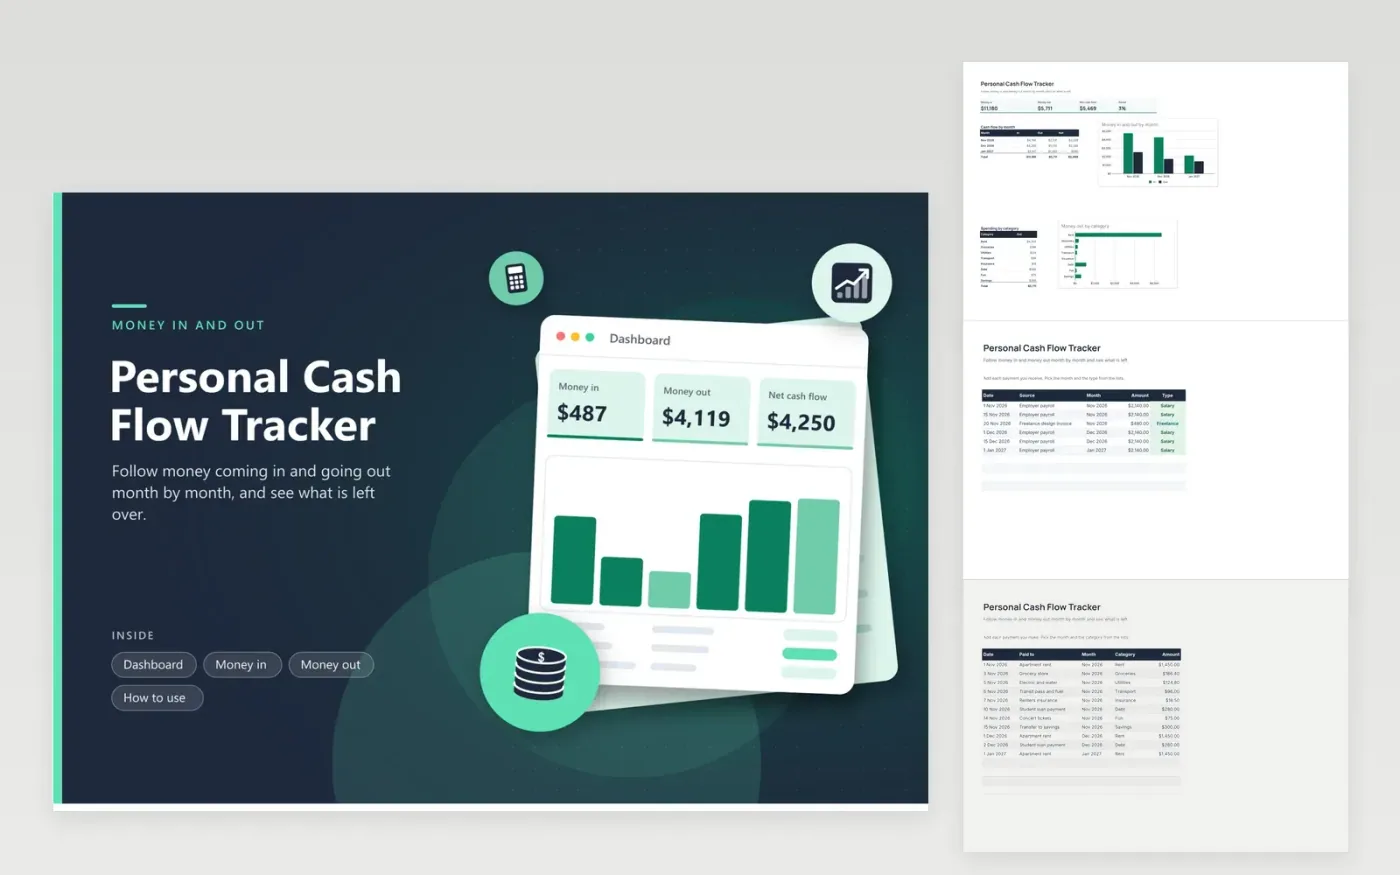
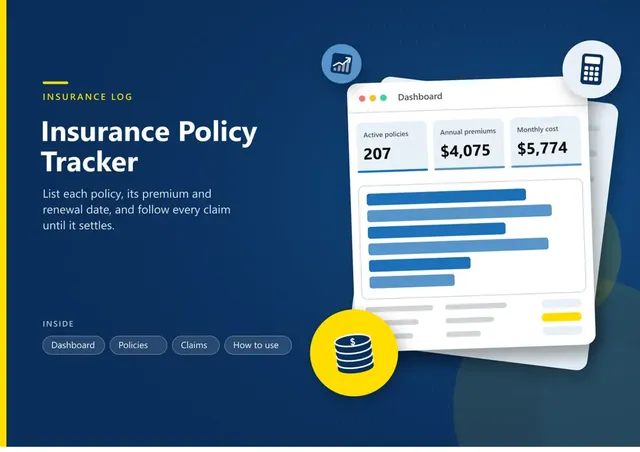
This tracker is for individuals and couples who want to watch each month's income and spending side by side. The Money in tab records pay and other income by month and type. The Money out tab records rent, groceries, debt, savings and other payments. The Dashboard shows the totals, net cash flow, a savings rate and a monthly chart.
The sample file covers November 2026 to January 2027, with one freelance payment and a student loan payment. Change the month lists on both data tabs when your months change, and type your real entries over the example ones. Check the net figure for each month before you plan the next one, and move any surplus to savings if you can.
Click Make a copy in Google Sheets, then confirm on the Google page. The copy is saved to your own Google Drive.
Start on the Money in tab: replace the sample rows with your own.
Keep the formula columns as they are; they fill in as you type.
Read the How to use tab for tips. For Excel, download the .xlsx file instead.
It divides the money paid into the Savings category by the total money in. For example, 300 saved from 4,760 coming in gives a rate of about 6 percent. Log transfers to savings as a Savings payment on the Money out tab.
The sheet only counts what you log. Money that stays in an account, card payments not yet logged, or income you have not entered will change the total. Check the rows against your statements each month.
Yes. Add rows for expected pay and bills with a future month, and they will count in the monthly chart. Mark them clearly in the Source or Paid to text, so you can tell expected figures from actual ones.
Docs + Word6 pages
FeaturedFree
Excel
FeaturedFree
Sheets + Excel9 tabs
Free
Sheets + Excel5 tabs
Free
Sheets + Excel5 tabs
Free
Sheets + Excel4 tabs
Free
Sheets + Excel5 tabs
Free
Sheets + Excel5 tabs
Free
Sheets + Excel5 tabs
Free
Sheets + Excel4 tabs
Free
Sheets + Excel4 tabs
Free
Sheets + Excel5 tabs
Free
Sheets + Excel3 tabs
Free
Sheets + Excel3 tabs
Free
Sheets + Excel3 tabs
Free