Market Research Presentation
Slides + PowerPoint18 slides
Free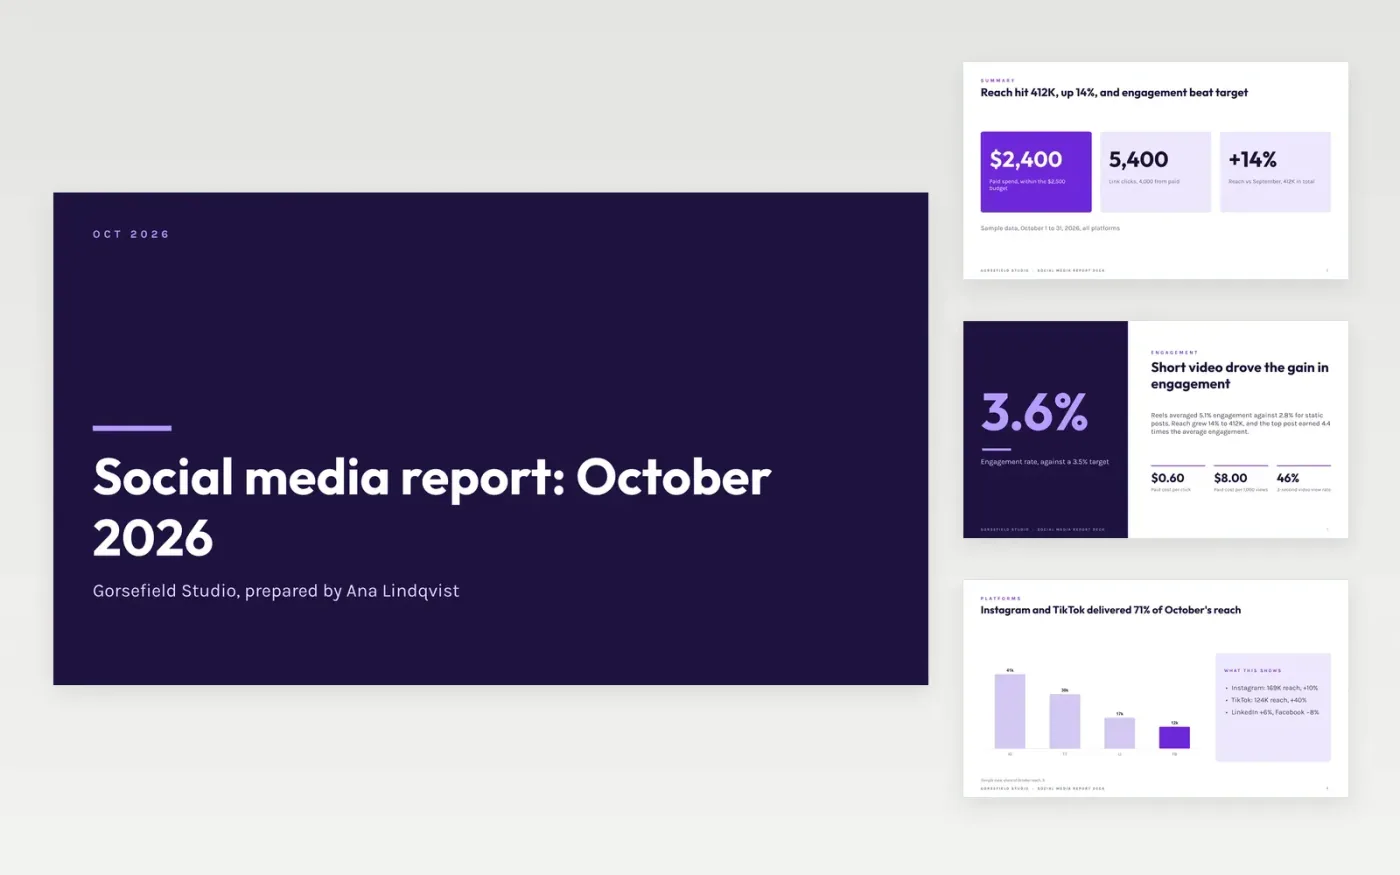
A monthly social report fails when it recites metrics without saying what changed, why, or what happens next. This deck is organized around that sequence: a summary with headline KPIs, platform results with a plain-language reading of each, a scorecard against agreed targets, the top post, audience growth, learnings written as what you saw and what you will change, and next month's tests.
The sample covers October 2026 for Gorsefield Studio, a fictional creative agency: 412K reach, up 14%, a 3.6% engagement rate against a 3.5% target and $2,400 of paid spend. Replace the month, the KPIs in your agreed targets, the figures, the top posts and one underperformer, and rewrite the learnings and tests for your own channels.
Click Make a copy in Google Slides, then confirm on the Google page. The copy is saved to your own Google Drive.
Set the reporting month and replace the headline KPIs with the ones in your agreed targets.
Paste your analytics figures into the charts and scorecard, and update the change column against last month.
Choose three top posts and one underperformer with a one-line reason each, then rewrite the learnings and next month's tests.
Delete the guide slide, then share the deck or present it.
Use the ones tied to your goal, such as reach, engagement rate, link clicks and follower growth, each against a target and last month. Leave out likes and raw impressions.
Delete the paid spend row on the scorecard and the paid facts on the engagement slide, then use the space for organic reach or community replies.
No. The organization, people and figures are fictional sample data. Replace every name, email address and number with your own before presenting.
Slides + PowerPoint18 slides
Free
Docs + Word6 pages
Free
Docs + Word12 pages
Free
Slides + PowerPoint11 slides
Free
Docs + Word8 pages
Free