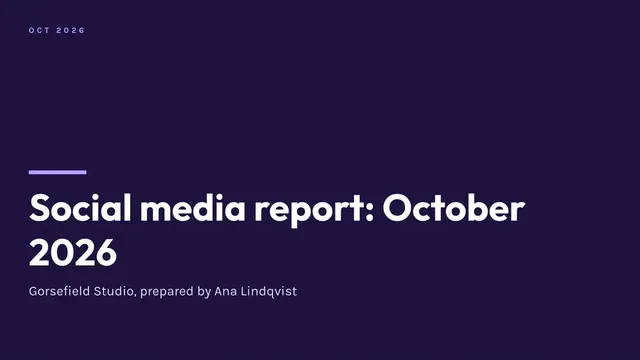
Social Media Report Deck
Slides + PowerPoint12 slides
Free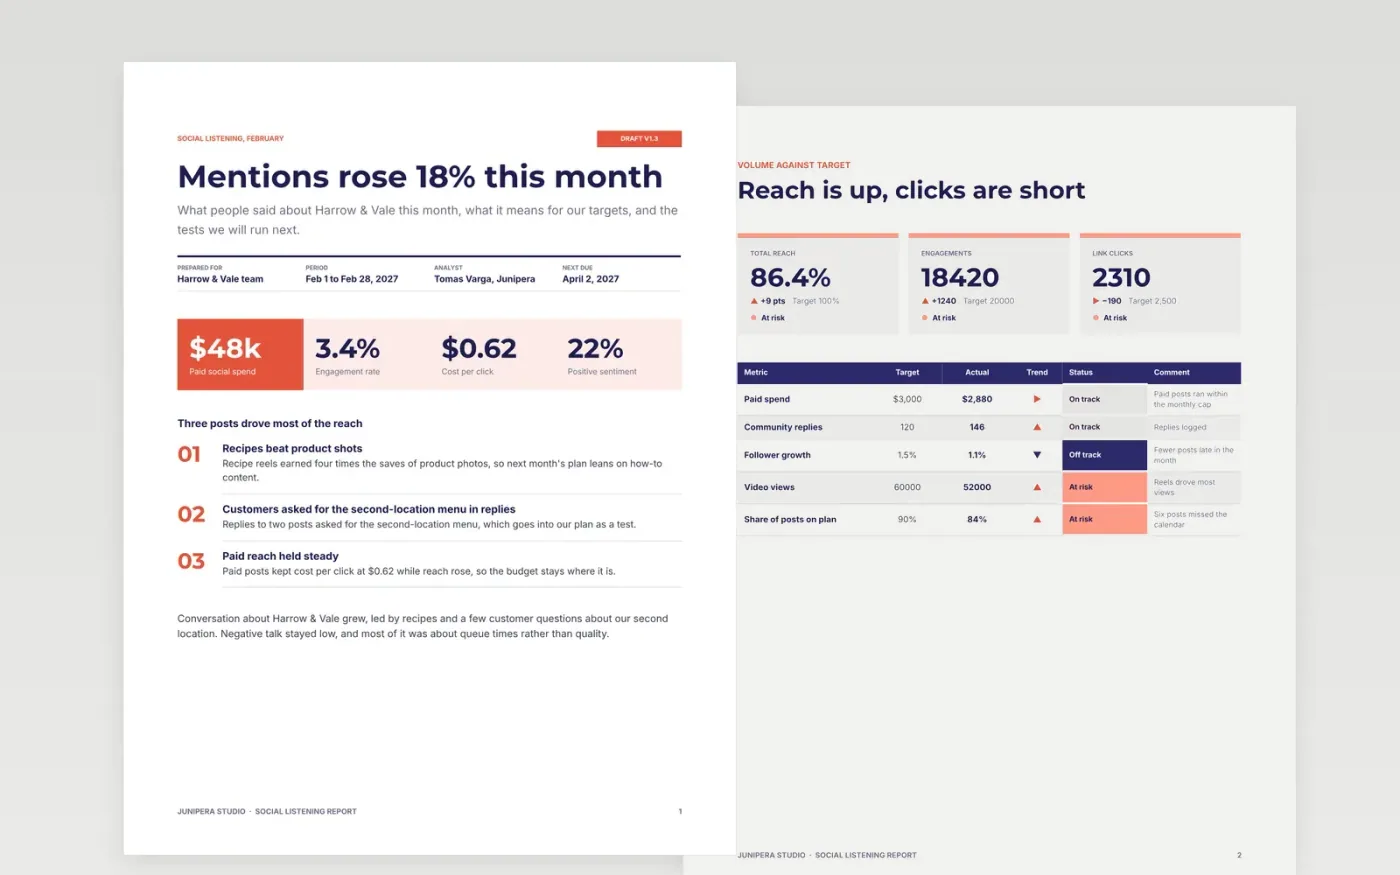
Clients and marketing directors rarely read analytics dashboards, so the month's learning gets lost. This template turns a month of conversation into a short report: the headline KPIs against target, volume, sentiment, themes, competitors and the actions for next month. Every chart carries a sentence on what changed, why and what the team will do about it.
The sample is for Harrow & Vale, a coffee chain with four stores, and covers February 2027 with reach, engagement, sentiment and a morning queue problem. Every brand, store, creator, figure and date is fictional. Replace the KPIs, posts and competitors with your own exports, check the sentiment by hand, and write the learnings in your own words.
Click Make a copy in Google Docs, then confirm on the Google page. The copy is saved to your own Google Drive.
Replace the brand, store names and targets on the summary and volume pages with your agreed figures.
Paste your analytics exports into the figure tables, then check each total against its platform.
Pick three top posts and one underperformer, each with a one-line reason, then write the learnings.
Delete the guide page, then send the report to the client with a date for the review call.
Yes. Harrow & Vale, Junipera Studio, Tomas Varga, the posts, creators, competitors and every figure are fictional. Replace them with real exports and targets before anything reaches a client.
Automated tools misread sarcasm, slang and local references. Checking a weekly sample by hand keeps the sentiment split honest, and the report should say how the sample was checked.
One sentence per chart that states the change, the cause and the action is usually enough. If a chart needs a paragraph to explain it, the chart is probably showing the wrong measure.
Slides + PowerPoint12 slides
Free
Docs + Word6 pages
Free
Google Sheets
Free