Social Media Report Deck
Slides + PowerPoint12 slides
Free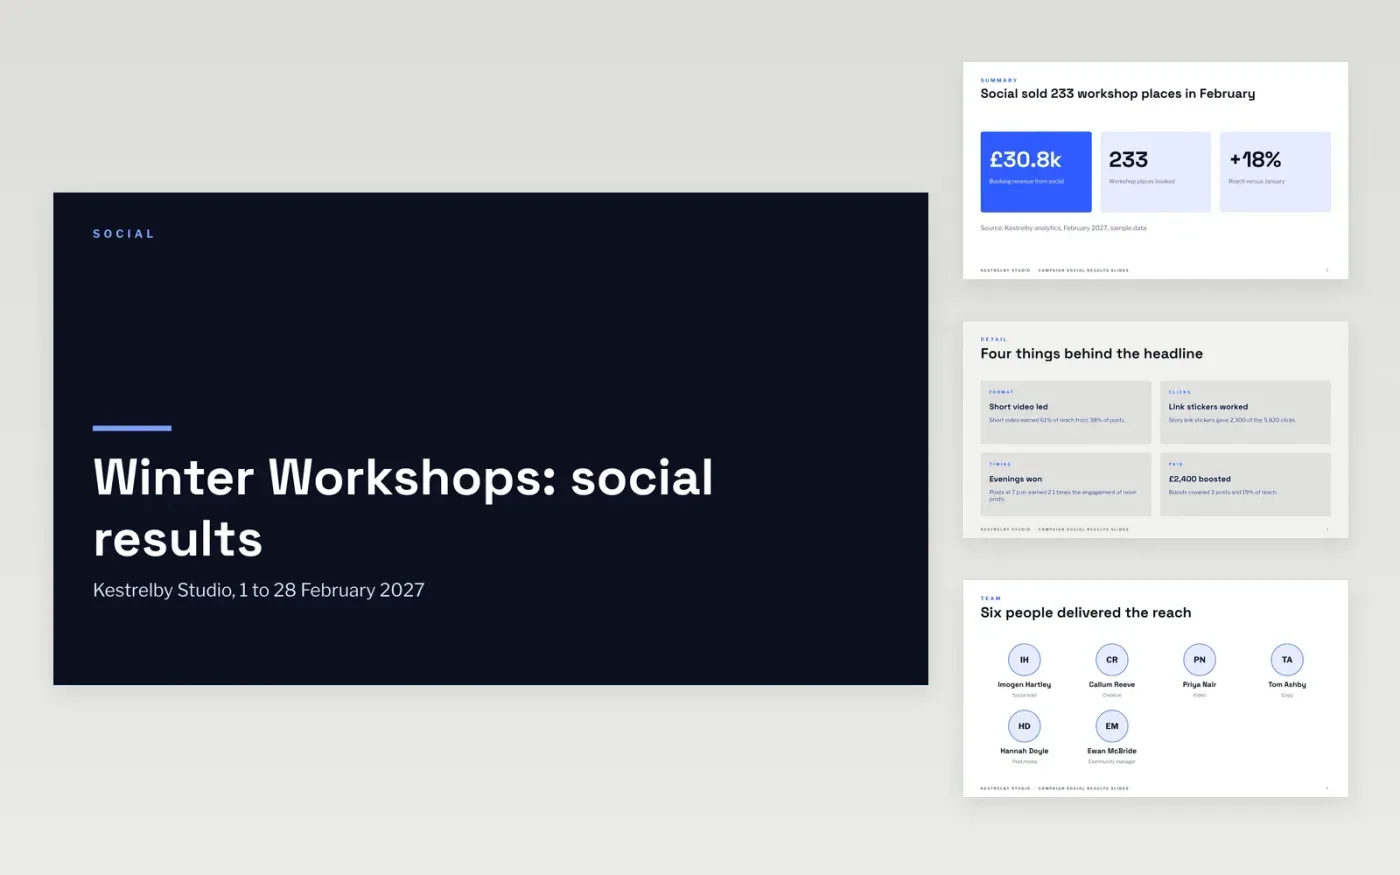
Campaign reports often list likes and impressions without saying what they achieved. This eleven-slide deck follows a single campaign from headline numbers through reach, engagement and conversions to learnings, so a client can judge value without opening any analytics tool.
The sample reports a fictional workshop campaign by Kestrelby Studio: 412,000 people reached, 5,820 link clicks and 233 bookings worth £30.8k. Replace the campaign, dates, figures, creators and learnings with your own, and keep the sentence under each chart that says what changed and why.
Click Make a copy in Google Slides, then confirm on the Google page. The copy is saved to your own Google Drive.
Replace the campaign name, dates and headline numbers with the targets you agreed with your client.
Paste your analytics figures into the scorecard, chart and funnel, and update the change notes.
Rewrite the learnings as 'we saw X, so we will test Y', and name the team and contacts.
Delete the Make it yours guide slide, then share or present the deck.
Yes. Add spend, cost per click and cost per booking to the scorecard and funnel notes. Remove the paid detail if you ran no ads this period.
Any. The sample talks about formats such as short video and carousels rather than platform names, so you can swap in your own channels and metrics.
No. Kestrelby Studio, its team and every figure are fictional sample data. Replace all of them with your own results before you share the deck.
Slides + PowerPoint12 slides
Free
Docs + Word6 pages
Free
Google Sheets
Free