Network Topology Diagram
Slides + PowerPoint5 slides
Free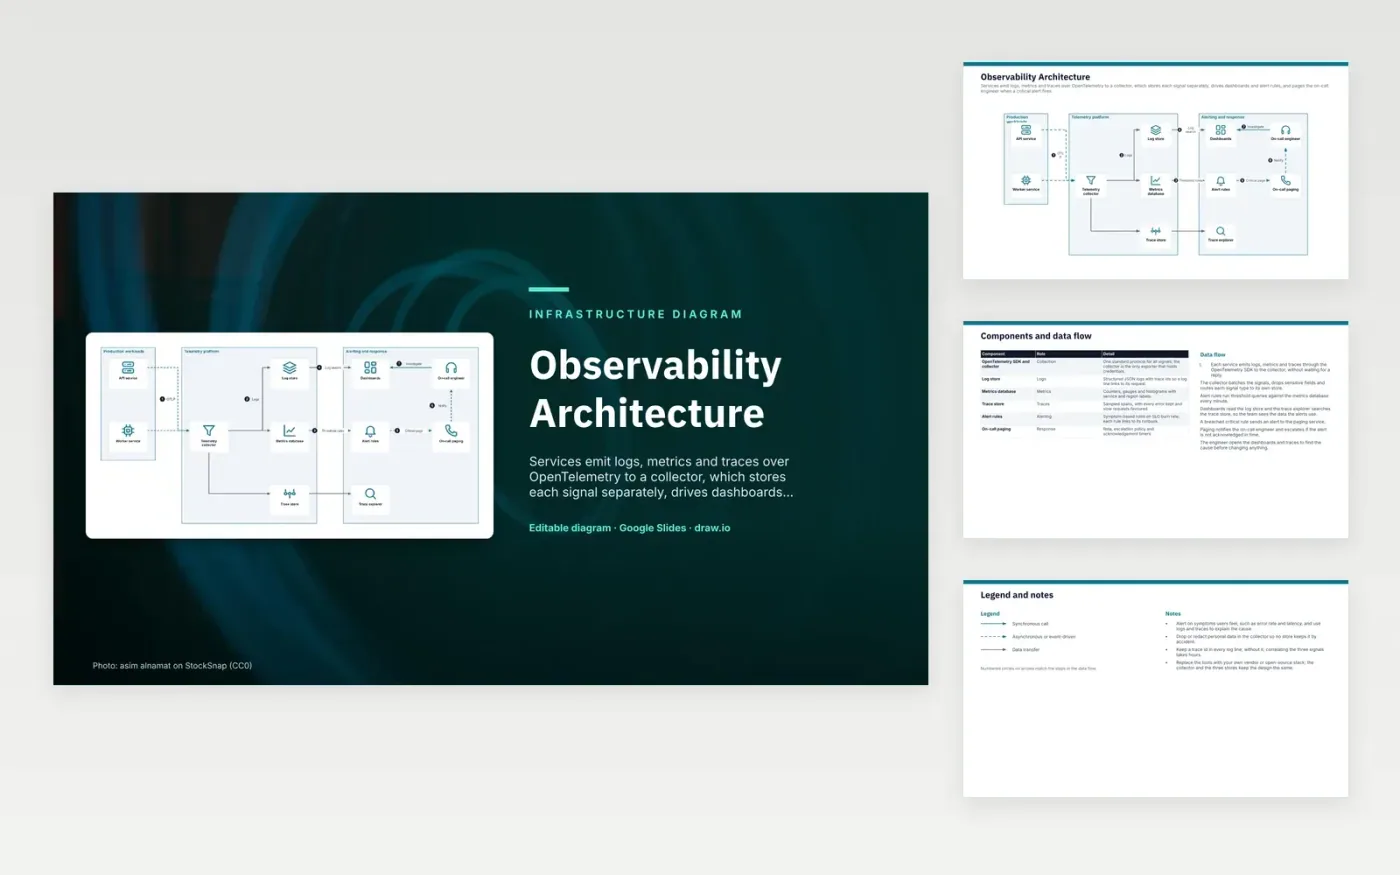
Each service sends logs, metrics and traces through the OpenTelemetry SDK to a collector, without waiting for a reply. The collector batches the signals, drops sensitive fields and sends each type to its own store. Alert rules run threshold queries against the metrics database every minute. A breached critical rule sends a page to the paging service, which notifies the on-call engineer and escalates if the alert is not acknowledged in time. The engineer then opens the dashboards and traces to find the cause.
The design point is to alert on symptoms users feel, such as error rate and latency, and to use logs and traces to explain the cause. Sampling keeps every error and favours slow requests, which keeps trace storage affordable. The collector is the only component that holds exporter credentials and the one place to redact personal data. To adapt it, swap in your own vendor or open-source tools and keep the collector and the three stores.
Click Make a copy in Google Slides, then confirm on the Google page. The copy is saved to your own Google Drive.
Rename API service, Worker service, Telemetry collector and the other boxes inside Production workloads to your own components, and delete the ones your system does not have.
Rewrite the 7-step data flow and the 6-row components table so they match the arrows you keep.
For the draw.io version, download observability-architecture-diagram.drawio and open it at app.diagrams.net.
The collector receives logs, metrics and traces from services, processes them and exports them to one or more back ends. Here it batches, samples and redacts before routing each signal to its own store.
Users feel errors and slow responses, not high CPU on its own. Alerts on symptoms such as SLO burn rate page the team when customers are affected, which cuts noise from harmless spikes.
A trace id is an identifier carried by every span of one request as it crosses services. Writing it into each log line lets an engineer jump from a log entry to the full request trace.
More Google Slides templatesMore developer workflows templates
Slides + PowerPoint5 slides
Free
Slides + PowerPoint5 slides
Free
Slides + PowerPoint5 slides
Free
Slides + PowerPoint5 slides
Free
Slides + PowerPoint5 slides
Free
Slides + PowerPoint5 slides
Free
Slides + PowerPoint5 slides
Free
Slides + PowerPoint5 slides
Free