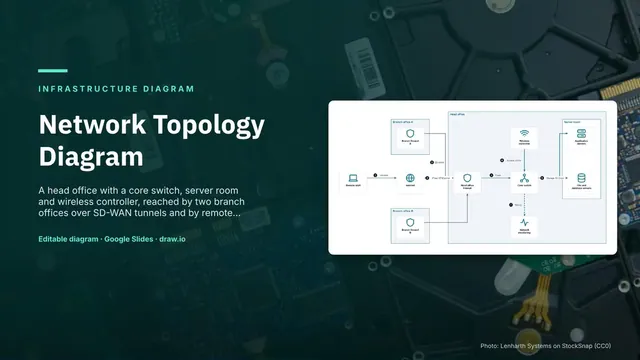
Network Topology Diagram
Slides + PowerPoint5 slides
Free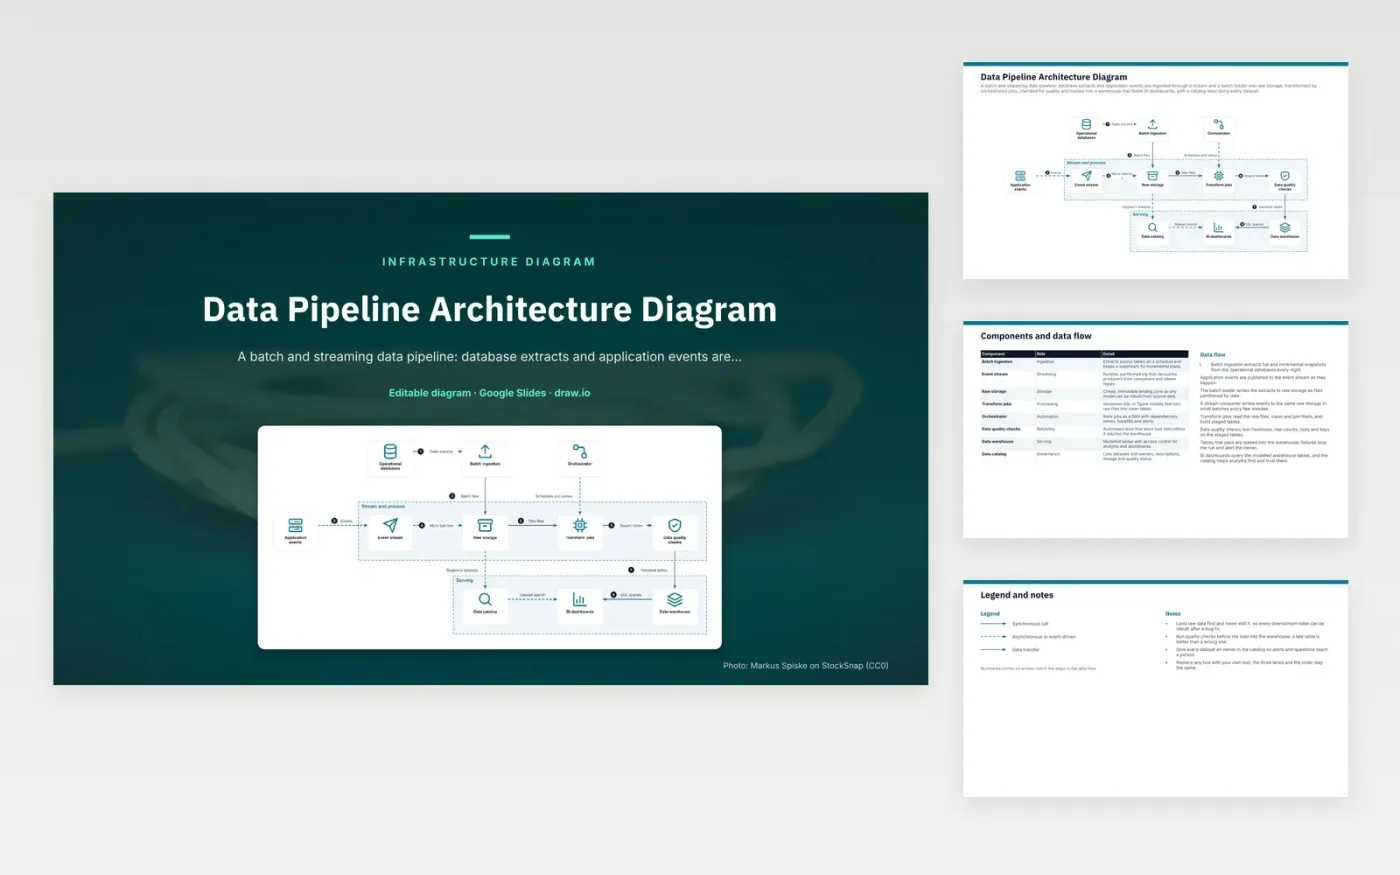
Nightly batch ingestion extracts full and incremental snapshots from the operational databases, while application events reach an event stream as they happen. Both paths write to raw storage: batch files arrive once a night, and micro-batches from the stream land every few minutes. Transform jobs read the raw files and build staged tables. Quality checks test freshness, row counts, nulls and keys, and only tables that pass load into the warehouse, which BI dashboards query.
Raw storage is an immutable landing zone, so any model can be rebuilt from the source data after a bug fix. Running the checks before the load is a deliberate trade-off: a late table is better than a wrong one. A failed check stops the run and alerts the owner. The data catalog records each dataset's owner, schema and lineage. To adapt the pipeline, keep the three lanes and their order, and swap in your own ingestion, transform and warehouse tools.
Click Make a copy in Google Slides, then confirm on the Google page. The copy is saved to your own Google Drive.
Rename Operational databases, Batch ingestion, Event stream and the other boxes inside Stream and process to your own components, and delete the ones your system does not have.
Rewrite the 8-step data flow and the 8-row components table so they match the arrows you keep.
For the draw.io version, download data-pipeline-architecture-diagram.drawio and open it at app.diagrams.net.
Raw files are kept unchanged, so any downstream table can be rebuilt from them after a transform is fixed. Without that copy, a transform bug can leave no way to recover the original values.
The checks catch stale, empty or duplicate tables before analysts query them, so a dashboard does not show a silently wrong number. A failed check stops the run and alerts the dataset owner.
A partitioned event stream receives events as they happen and keeps them for a set period, here seven days, so consumers can replay them. A batch extract copies a snapshot of tables on a schedule, so its data can be up to a day old.
More Google Slides templatesMore developer workflows templates
Slides + PowerPoint5 slides
Free
Slides + PowerPoint5 slides
Free
Slides + PowerPoint5 slides
Free
Slides + PowerPoint5 slides
Free
Slides + PowerPoint5 slides
Free
Slides + PowerPoint5 slides
Free
Slides + PowerPoint5 slides
Free
Slides + PowerPoint5 slides
Free