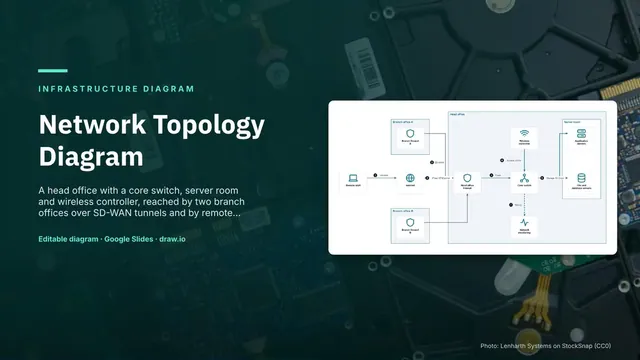
Network Topology Diagram
Slides + PowerPoint5 slides
Free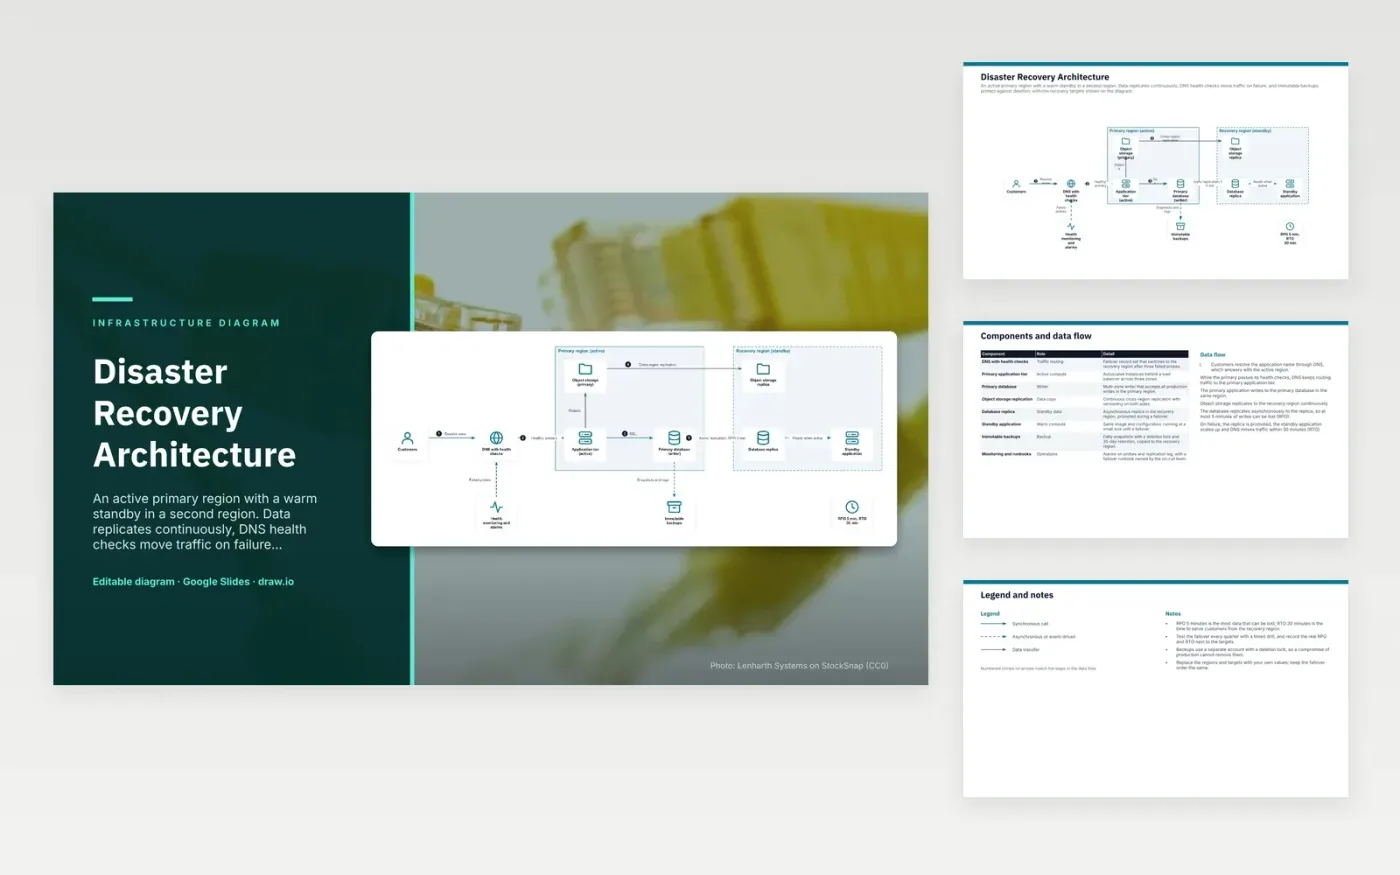
Customers resolve the application name through DNS with health checks, which answers with the primary region while it passes probes. The primary application tier writes to a multi-zone primary database and stores uploads in object storage. Object storage replicates to the recovery region continuously. The database replicates asynchronously to a replica there, so at most five minutes of writes can be lost. When probes fail, the replica is promoted, the standby application scales up and DNS moves traffic within the 30-minute recovery target.
The recovery targets drive the layout. The five-minute recovery point comes from asynchronous replication, and the 30-minute recovery time covers promoting the replica and scaling the standby. Backups sit in a separate account behind a deletion lock, so a compromised production account cannot remove them. Run a timed failover drill each quarter and record the real figures next to the targets. To adapt it, change the regions and targets, but keep the failover order.
Click Make a copy in Google Slides, then confirm on the Google page. The copy is saved to your own Google Drive.
Rename Customers, DNS with health checks, Object storage (primary) and the other boxes inside Primary region (active) to your own components, and delete the ones your system does not have.
Rewrite the 6-step data flow and the 8-row components table so they match the arrows you keep.
For the draw.io version, download disaster-recovery-architecture-diagram.drawio and open it at app.diagrams.net.
RPO, the recovery point objective, is the most data you can lose, here five minutes of writes. RTO, the recovery time objective, is how long it takes to serve customers from the recovery region, here 30 minutes.
An asynchronous replica can lag behind the primary, and two writable copies would risk conflicting data. Keeping it read-only until a failover is confirmed avoids that split.
If an attacker or a faulty script gets into production, they may delete the data and its backups together. A separate account with a deletion lock keeps a clean copy that production credentials cannot remove.
More Google Slides templatesMore developer workflows templates
Slides + PowerPoint5 slides
Free
Slides + PowerPoint5 slides
Free
Slides + PowerPoint5 slides
Free
Slides + PowerPoint5 slides
Free
Slides + PowerPoint5 slides
Free
Slides + PowerPoint5 slides
Free
Slides + PowerPoint5 slides
Free
Slides + PowerPoint5 slides
Free