Market Research Presentation
Slides + PowerPoint18 slides
Free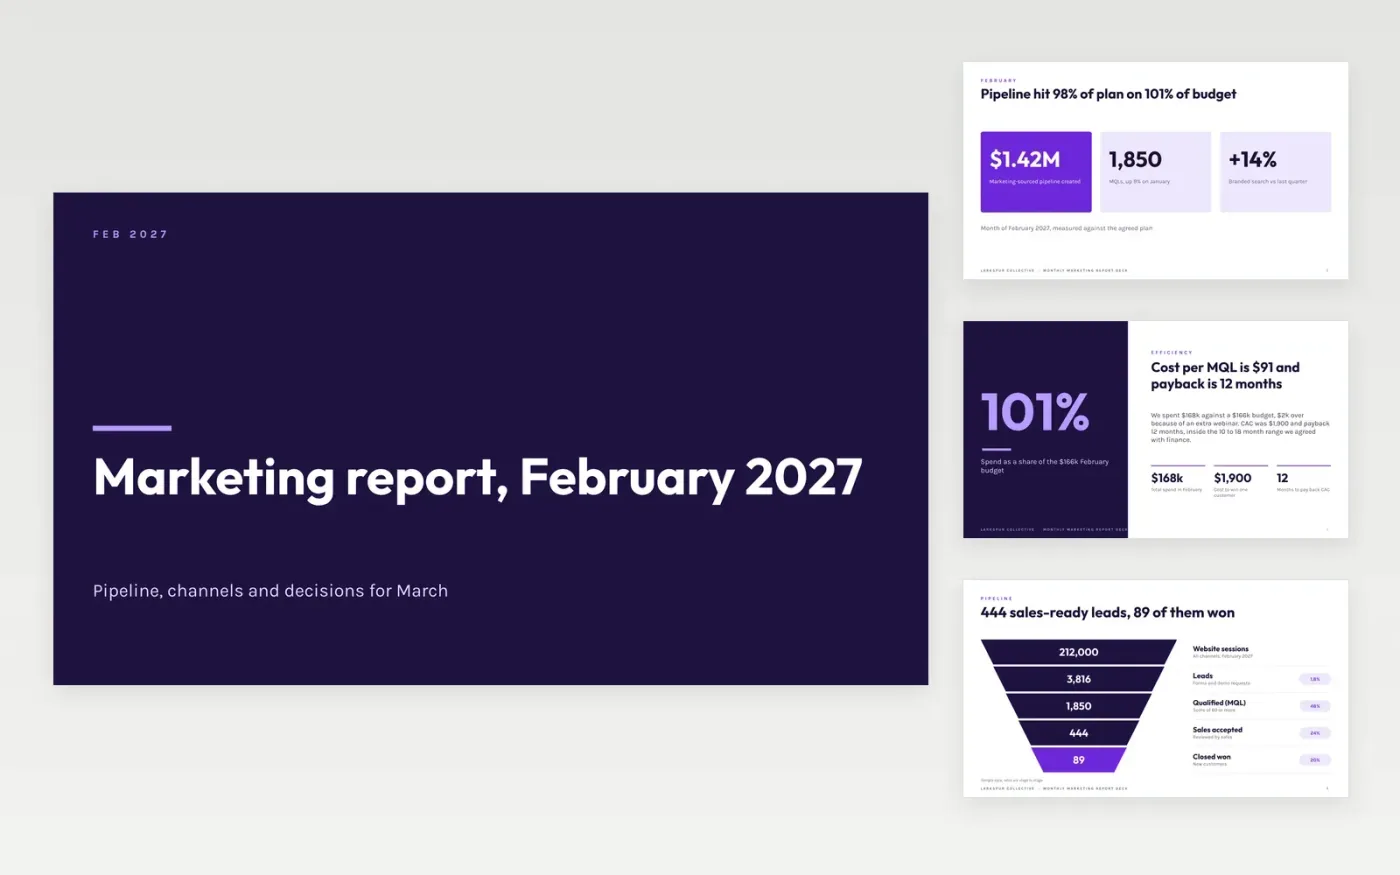
Leadership wants to know whether marketing is producing pipeline, which channels deserve more money and what changes next month. This deck answers in order: headline KPIs against plan, the funnel from website visit to closed deal, results by channel, campaign highlights, spend and a short roadmap of next month's work.
The sample is the February 2027 report of Larkspur Collective, a fictional company: $1.42M of marketing-sourced pipeline, 98% of plan, on 101% of budget. Every figure agrees from the funnel to the channel cards. Replace the KPIs with the ones in your agreed targets, enter your own pipeline and spend from the CRM and finance system, and finish with the decisions you need.
Click Make a copy in Google Slides, then confirm on the Google page. The copy is saved to your own Google Drive.
Set the month and replace the headline KPIs with the ones in your agreed targets, adding a line on each variance over 10%.
Enter your own funnel counts, channel pipeline and spend from your CRM and finance system, and check that the parts add to the totals.
Rewrite the March roadmap and the decisions line so the reader knows what you need from them.
Delete the guide slide, then share or present the deck.
No. Larkspur Collective, its people and every figure are fictional sample data. Replace them with your own numbers before you present.
Yes. Change the period on the cover, use quarterly counts in the funnel and spend chart, and change the roadmap columns from weeks to months.
Agree one attribution rule with sales first and state it in the caption. In the sample, pipeline is counted once, by the CRM source field.
Slides + PowerPoint18 slides
Free
Docs + Word6 pages
Free
Google Sheets
Free
Slides + PowerPoint10 slides
Free
Slides + PowerPoint10 slides
Free