Monthly Marketing Report Deck
Slides + PowerPoint10 slides
Free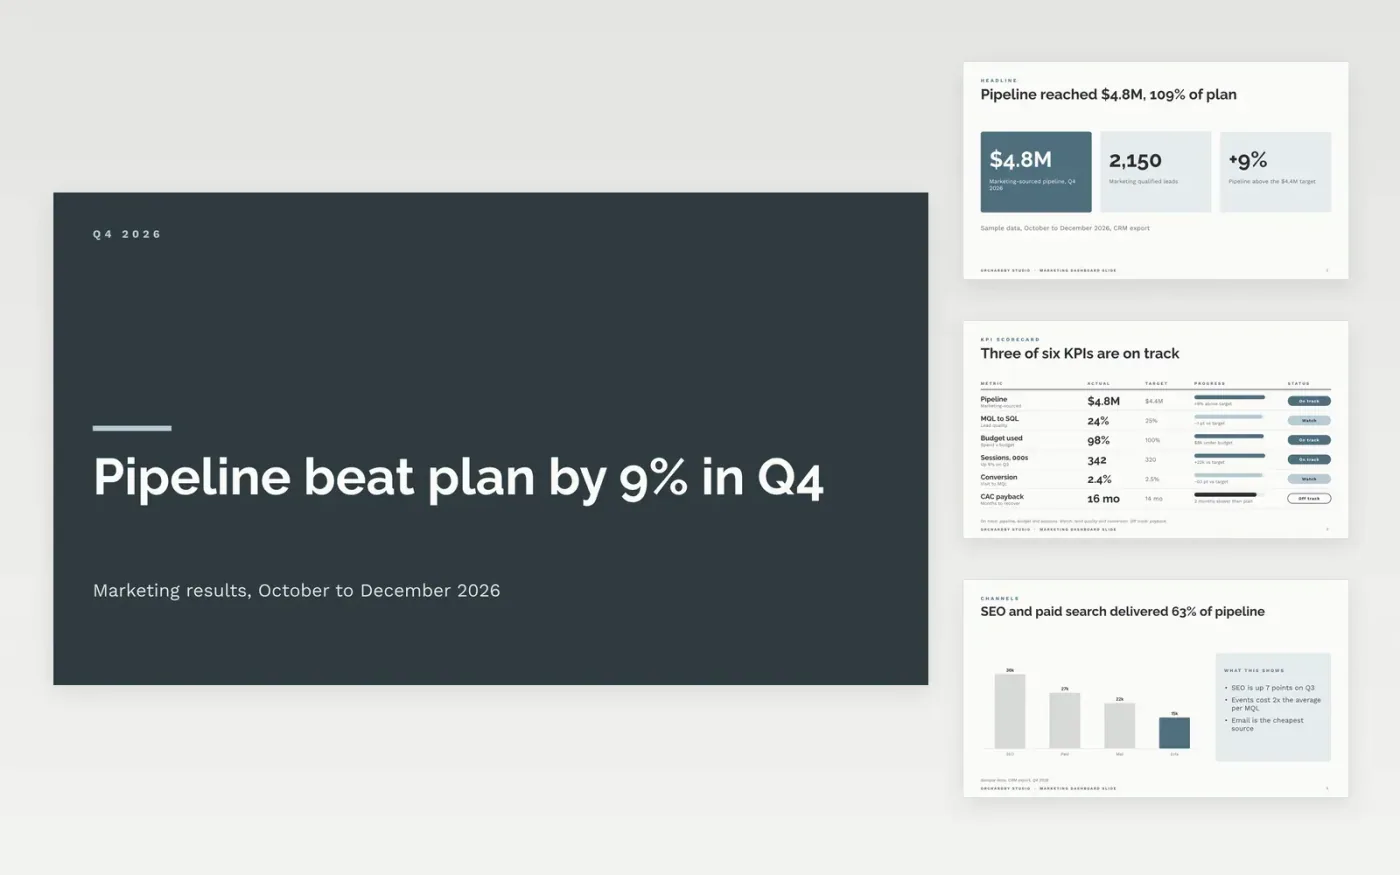
Executives do not want thirty metrics without commentary. This deck leads with the headline numbers, then a six-line scorecard with progress and status, a channel chart, a cost slide, a conversion story, a traffic trend and a spend summary, each with a line on why it moved.
The sample follows Orchardby Studio, a fictional design and marketing studio, for the fourth quarter of 2026: $4.8M of marketing-sourced pipeline at 109% of target, 2,150 qualified leads, a 25% win rate and spend at 98% of budget. Replace the figures from your CRM and finance system, and finish with the decisions you need.
Click Make a copy in Google Slides, then confirm on the Google page. The copy is saved to your own Google Drive.
Replace the headline numbers and the scorecard with the KPIs in your agreed targets, and set the period on the cover.
Enter plan and actual figures from your CRM and finance system, and write one line on each variance over 10%.
Update the channel and traffic charts with your own data, and remove any metric the executive team never asks about.
Delete the Make it yours slide, then present the deck or share it with your leadership team.
Eight or fewer. The sample uses three headline figures and a six-line scorecard, each against a target and with a reason. Cut anything leadership has never asked about.
Agree one attribution rule first and state it on the slide. The sample credits the first marketing touch for sourced pipeline and says so in the caption.
No. Orchardby Studio, its people and every figure and email address in the sample are fictional and exist only to show what a finished dashboard looks like.
Slides + PowerPoint10 slides
Free
Slides + PowerPoint10 slides
Free
Docs + Word6 pages
Free