Customer Survey Report
Docs + Word7 pages
Free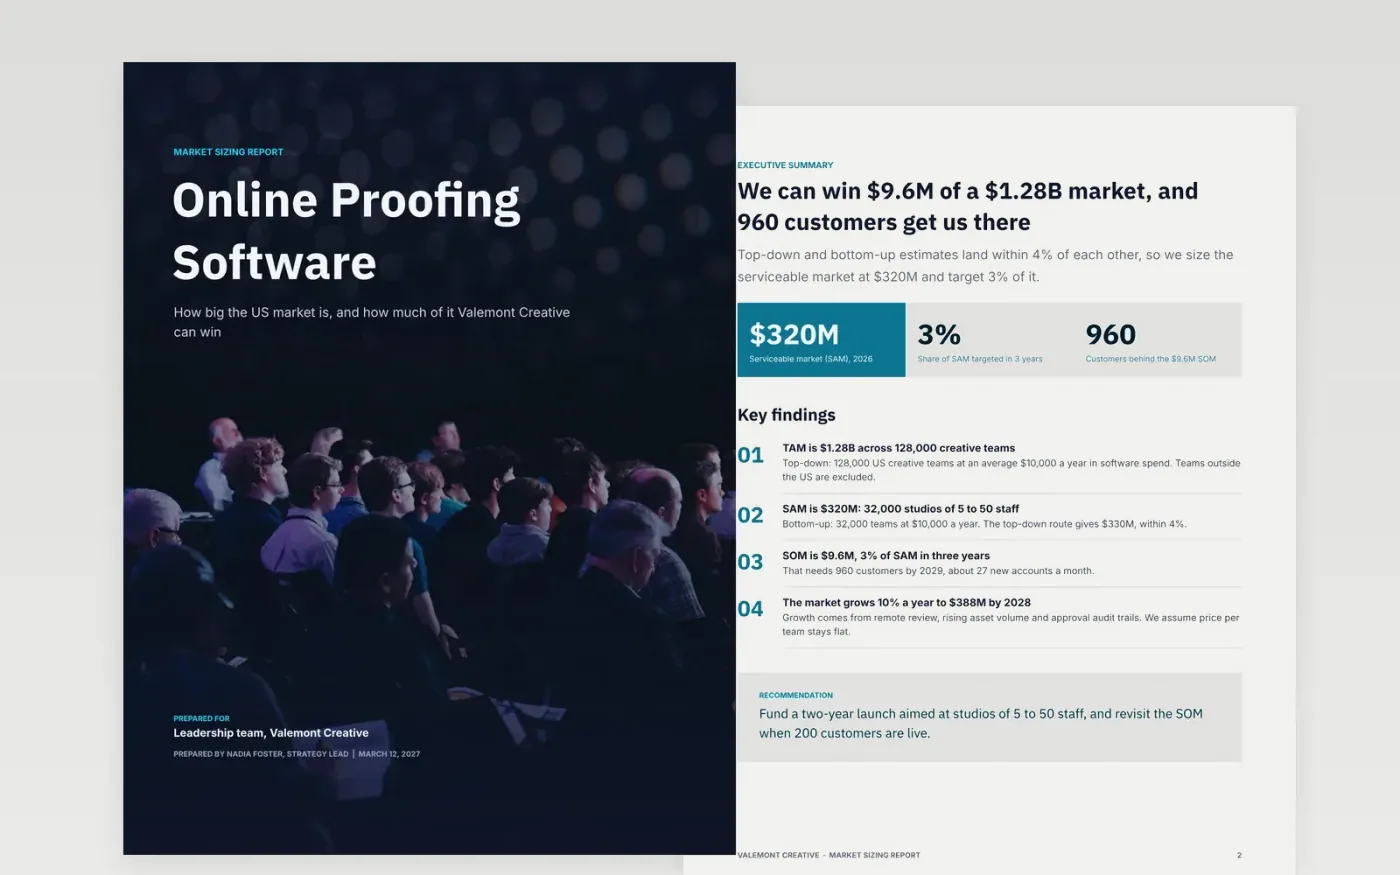
Founders and strategy teams are asked how big the market is, and a single top-down number rarely survives questions. This report states the answer first, then builds TAM, SAM and SOM two ways, top-down from industry totals and bottom-up from counts of buyers and price, and reconciles the gap. Growth, scope, assumptions and sources follow, so an investor can check each figure.
The sample sizes the US market for online proofing software for Valemont Creative, a fictional studio: a $1.28B TAM, a $320M SAM and a $9.6M SOM, with the two methods 3% apart. Replace the market definition, the team counts and average price, the growth drivers and the survey details with your own, and keep the base size beside every percentage.
Click Make a copy in Google Docs, then confirm on the Google page. The copy is saved to your own Google Drive.
Replace the market definition, scope and base year with your own, and state the buyer you are counting.
Enter your top-down and bottom-up figures in the table and write one line of cause for every material gap.
Update the growth drivers, forecast and survey details, and keep the sample size beside each percentage.
Delete the guide page, then share the document or present it.
TAM is total demand for your product category. SAM is the part you can serve with your product and channels. SOM is the share of SAM you can realistically win in a set period.
Top-down uses industry totals and is fast but loose. Bottom-up multiplies buyer counts by price and is slower but testable. If the two land close together, the figure is easier to defend.
No. The organization, people and figures are fictional sample data. Replace every name, email address and number with your own before sharing the report.
Docs + Word7 pages
Free
Slides + PowerPoint18 slides
Free
Docs + Word12 pages
Free
Docs + Word6 pages
Free
Docs + Word9 pages
Free
Docs + Word8 pages
Free