Market Research Presentation
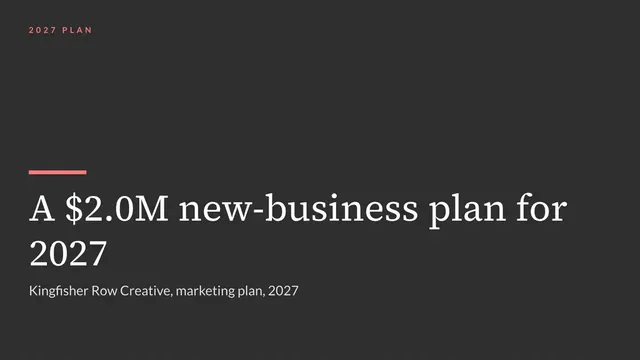
Slides + PowerPoint18 slides
Free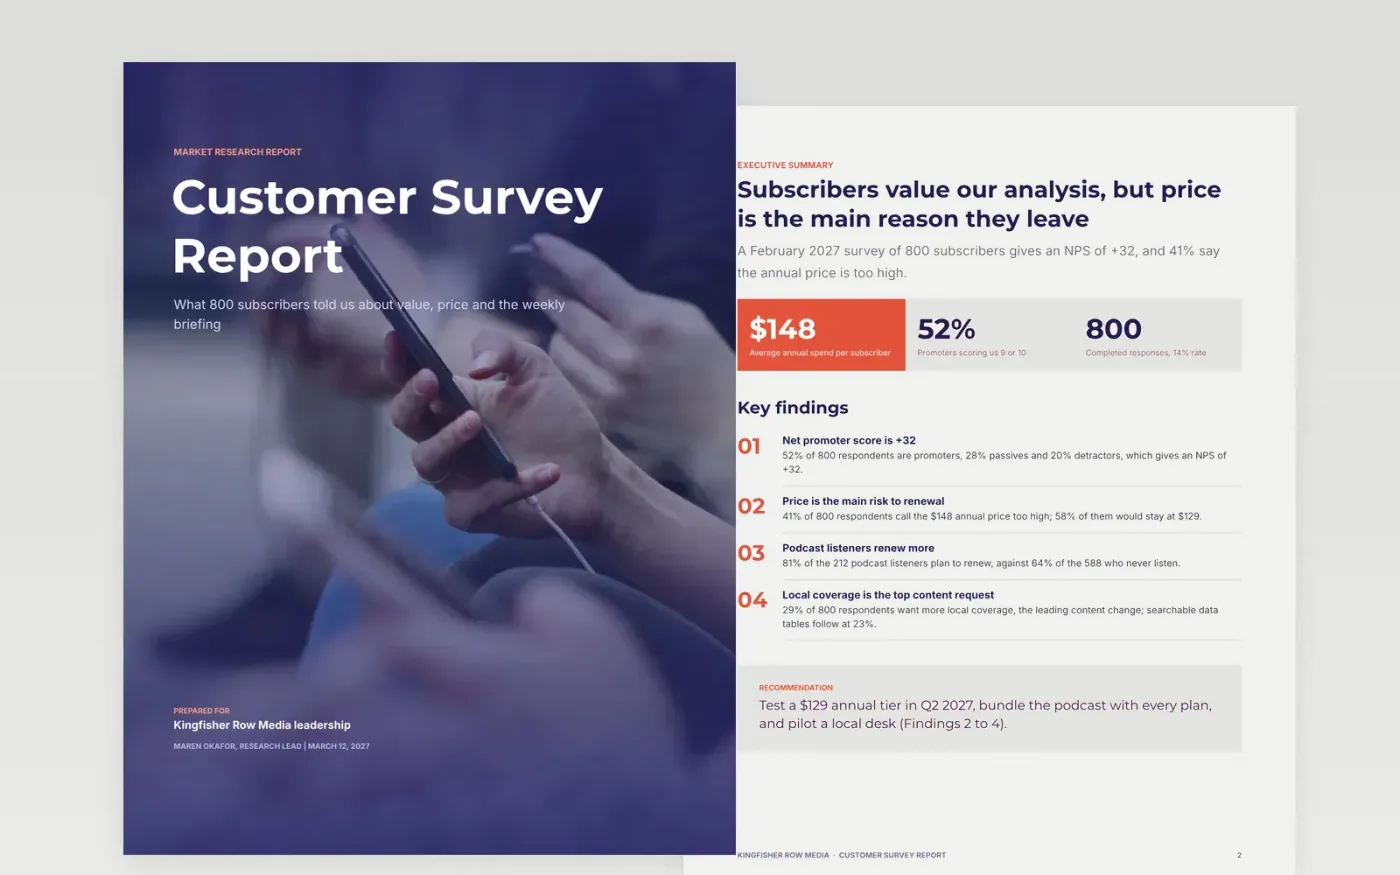
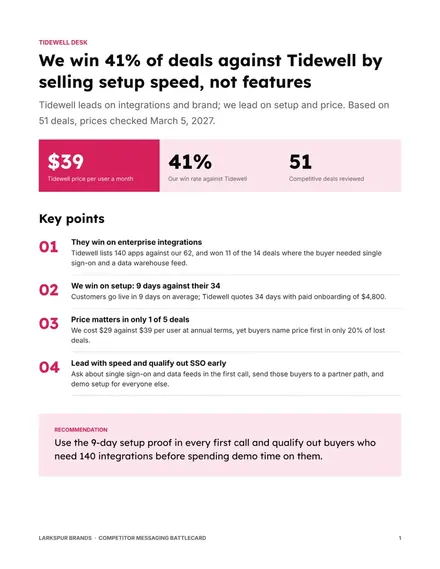
Survey results usually arrive as a spreadsheet nobody wants to read. This Google Docs template puts the answer first, then shows who responded, what they said and what to do about it. It runs across seven pages: a summary with headline figures and a recommendation, method and sample, findings with charts, verbatim comments, actions, and a short guide for making it yours.
The sample follows Kingfisher Row Media, a fictional publisher, through a February 2027 survey of 800 subscribers with a 14% response rate and a margin of error of plus or minus 3.5%. Every percentage states its base, and four numbered findings feed the actions. Replace the research question, the sample table, the chart data and the quotes, and keep at least one comment that disagrees with your main finding.
Click Make a copy in Google Docs, then confirm on the Google page. The copy is saved to your own Google Drive.
Replace the research question, sample table and fieldwork notes on the Method and sample page with your own.
Update each chart and rewrite the one-line takeaway beside it, stating the base size for every percentage.
Swap in four to six real verbatims, include one that disagrees, and link each action to a finding number.
Delete the Make it yours page, then share the document or present it.
No. Kingfisher Row Media, its subscribers, the quotes and every figure are fictional sample data, made up to show what a finished report looks like.
Yes. Replace the response table with your interview groups or sources, and keep the answer-first summary, the base sizes and the numbered findings.
No. It is a normal Google Docs file, so after you make your copy in your own Google Drive you edit the text and tables like any other document.
Slides + PowerPoint18 slides
Free
Docs + Word12 pages
Free
Docs + Word6 pages
Free
Docs + Word9 pages
Free
Docs + Word8 pages
Free
Docs + Word8 pages
Free