Annual Report
Docs + Word6 pages
FeaturedFree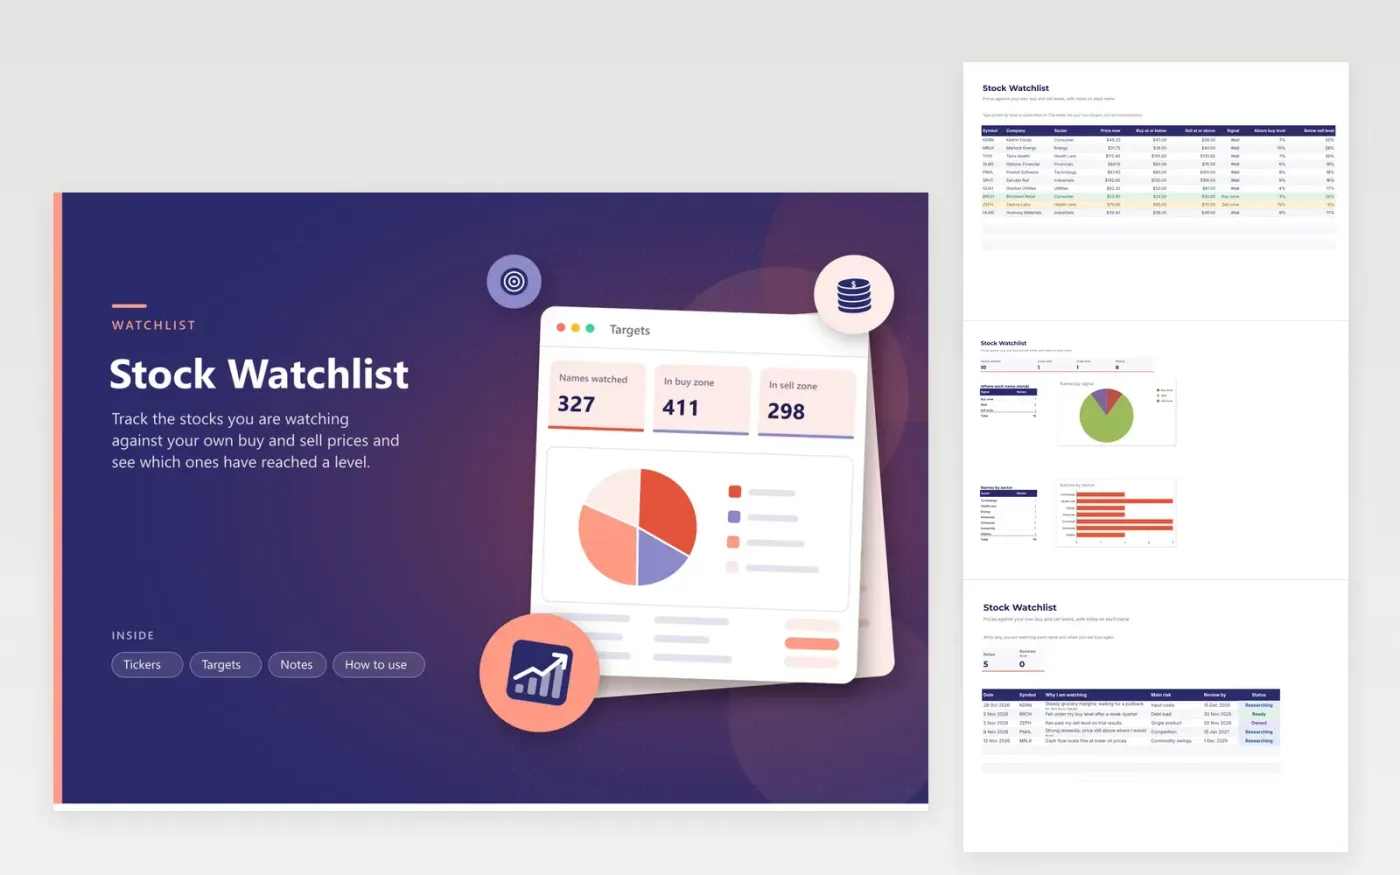
A watchlist is only useful if you write down the price at which you would act. On Tickers, list each symbol with its sector, the price now, a level at or below which you would buy and a level at or above which you would sell. The Signal column reads Buy zone, Sell zone or Wait, and two more columns show how far the price is above the buy level and below the sell level.
The Targets tab counts names in each zone and by sector. Notes keeps the reason you are watching, the main risk, a review date and a status such as Researching or Ready, plus a count of reviews that are due. Company names and prices are invented. Update prices by hand or paste them in.
Click Make a copy in Google Sheets, then confirm on the Google page. The copy is saved to your own Google Drive.
Start on the Tickers tab: replace the sample rows with your own.
Keep the formula columns as they are; they fill in as you type.
Read the How to use tab for tips. For Excel, download the .xlsx file instead.
List the stocks you follow with their current prices, then add the buy and sell prices you decided on in advance. Record why you are watching each one.
Enough that you can follow each one, which is often a dozen or two. The sector count in this sheet shows if the list is lopsided.
No. You type or paste prices, which keeps the file consistent in both programs and needs no add-ins.
Docs + Word6 pages
FeaturedFree
Excel
FeaturedFree
Sheets + Excel5 tabs
Free
Sheets + Excel6 tabs
Free
Sheets + Excel6 tabs
Free
Sheets + Excel5 tabs
Free
Sheets + Excel6 tabs
Free
Sheets + Excel6 tabs
Free
Sheets + Excel7 tabs
Free
Sheets + Excel5 tabs
Free
Sheets + Excel5 tabs
Free
Sheets + Excel5 tabs
Free
Sheets + Excel5 tabs
Free
Sheets + Excel6 tabs
Free
Sheets + Excel7 tabs
Free