Annual Report
Docs + Word6 pages
FeaturedFree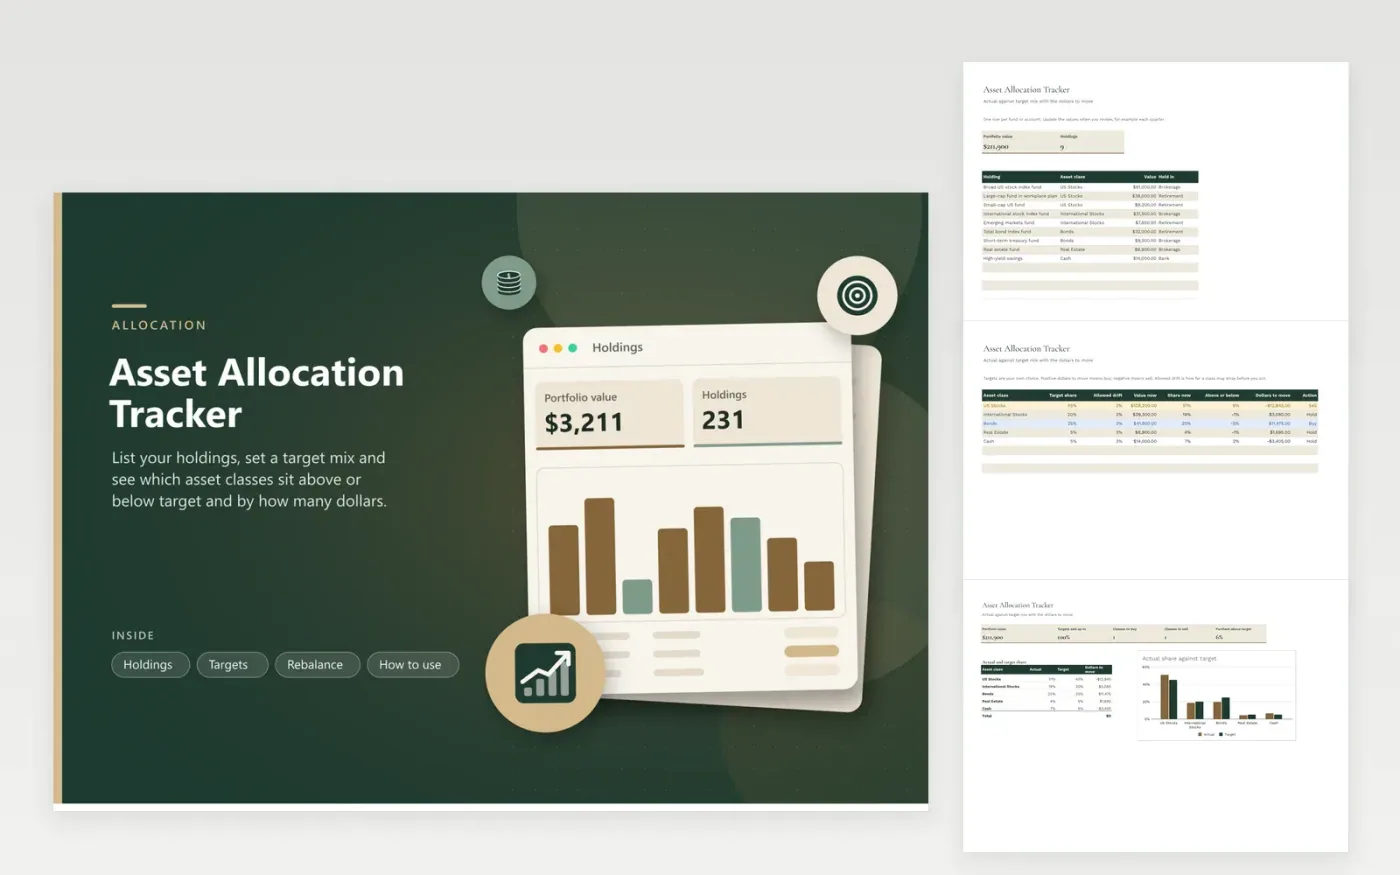
Enter each fund or account on the Holdings tab with its asset class and value. On Targets, give every class a target share and an allowed drift, which is how far it can stray before you act. The sheet works out the value and share now, the gap to target in percent points, the dollars to move and an action column reading Buy, Sell or Hold.
The Rebalance tab shows the portfolio total, whether your targets add up to 100 percent, how many classes need action and the class furthest above target, with a chart of actual against target shares. In the sample, US stocks sit 6 points over and bonds 5 under, so those two flag. The targets are yours to set; the sheet only measures against them.
Click Make a copy in Google Sheets, then confirm on the Google page. The copy is saved to your own Google Drive.
Start on the Holdings tab: replace the sample rows with your own.
Keep the formula columns as they are; they fill in as you type.
Read the How to use tab for tips. For Excel, download the .xlsx file instead.
It is how your money is split between types of investments such as stocks, bonds, real estate and cash. Your target split depends on your goals and comfort with risk.
Many investors review once or twice a year, or when a class drifts past a set band. The Allowed drift column lets you define that band for each class.
Drift is the difference between a class share today and its target. Growth in one class raises its share and lowers the others even if you add nothing.
Docs + Word6 pages
FeaturedFree
Excel
FeaturedFree
Sheets + Excel5 tabs
Free
Sheets + Excel6 tabs
Free
Sheets + Excel6 tabs
Free
Sheets + Excel6 tabs
Free
Sheets + Excel6 tabs
Free
Sheets + Excel7 tabs
Free
Sheets + Excel5 tabs
Free
Sheets + Excel5 tabs
Free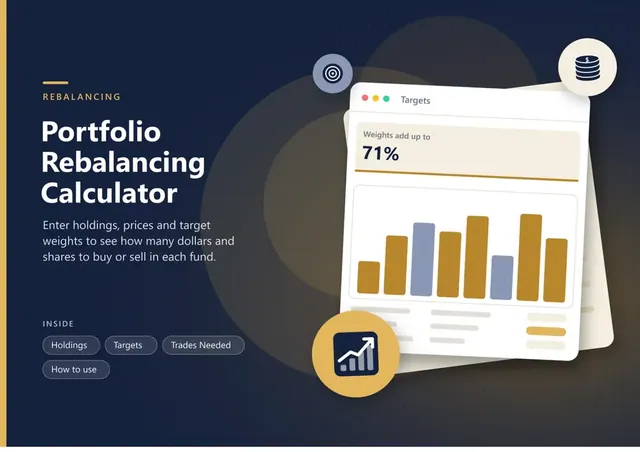
Sheets + Excel5 tabs
Free
Sheets + Excel5 tabs
Free
Sheets + Excel6 tabs
Free
Sheets + Excel7 tabs
Free
Sheets + Excel5 tabs
Free