Annual Report
Docs + Word6 pages
FeaturedFree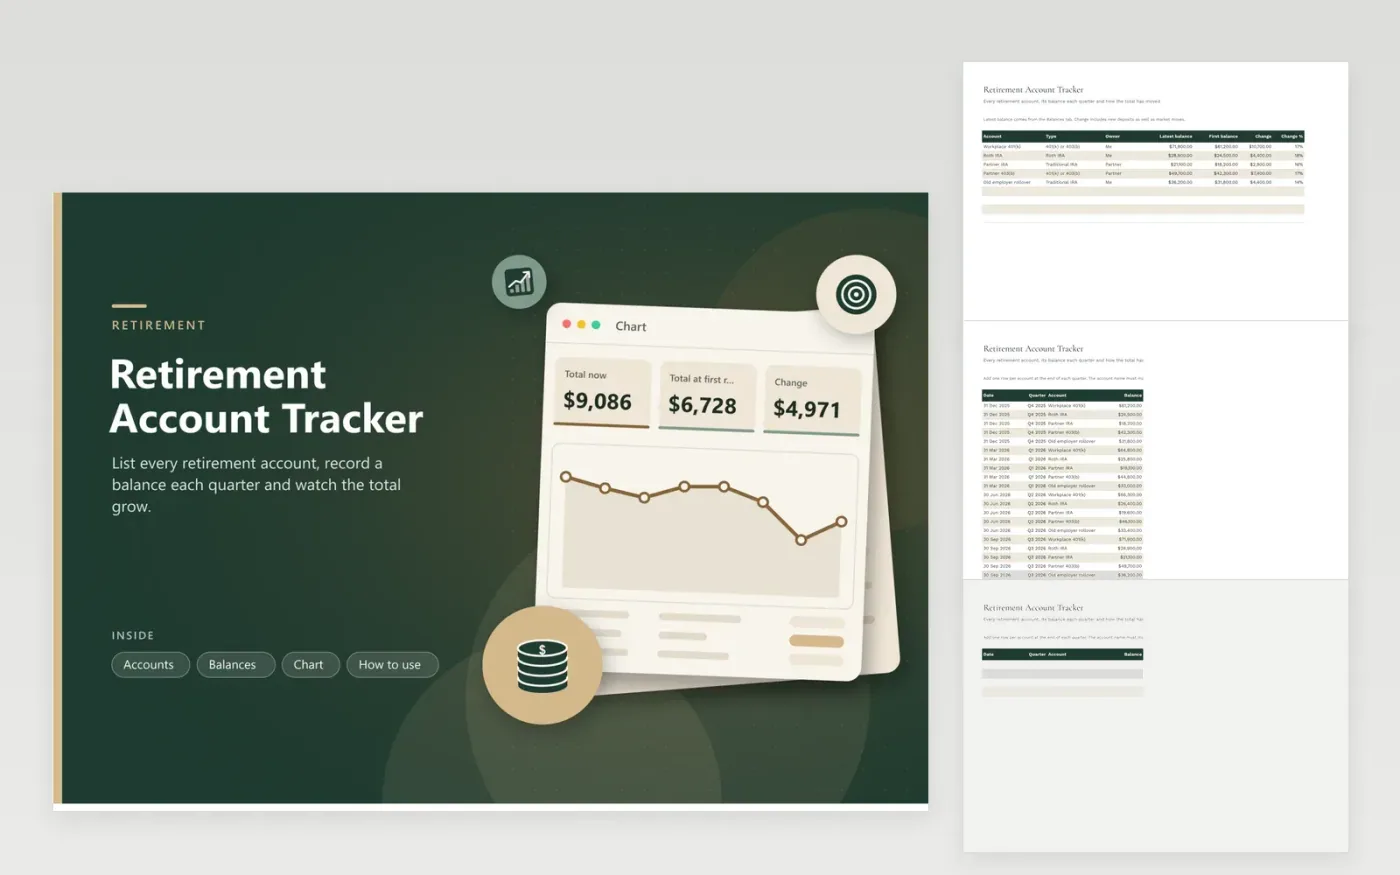
Retirement money tends to scatter across a workplace plan, an old employer rollover and a couple of IRAs. The Accounts tab lists each one with its type and owner, and works out the latest balance, the first balance on record and the change in both dollars and percentage. The Balances tab is where you add one row per account when each quarter closes, copied from the statement.
The Chart tab totals everything by quarter and splits the latest balances by type, so a shrinking old account or a fast-growing new one stands out. Sample data covers four quarter ends from December 2025 to September 2026. Change includes deposits and market moves together, so treat it as the change in balance, not as an investment return.
Click Make a copy in Google Sheets, then confirm on the Google page. The copy is saved to your own Google Drive.
Start on the Accounts tab: replace the sample rows with your own.
Keep the formula columns as they are; they fill in as you type.
Read the How to use tab for tips. For Excel, download the .xlsx file instead.
Make one row per account with its type and owner, then record each balance at a set time, for example on the final day of the quarter. Totals by quarter and by type give you the combined picture.
Many people record them once a quarter, which is often enough to see the trend without reacting to daily swings. Use statement dates so the numbers are comparable.
No. A balance rises when you deposit and when the market goes up, and falls on withdrawals and market drops. This sheet shows the change in balance; your provider reports investment return separately.
Docs + Word6 pages
FeaturedFree
Excel
FeaturedFree
Sheets + Excel5 tabs
Free
Sheets + Excel6 tabs
Free
Sheets + Excel6 tabs
Free
Sheets + Excel5 tabs
Free
Sheets + Excel6 tabs
Free
Sheets + Excel6 tabs
Free
Sheets + Excel7 tabs
Free
Sheets + Excel5 tabs
Free
Sheets + Excel5 tabs
Free
Sheets + Excel5 tabs
Free
Sheets + Excel5 tabs
Free
Sheets + Excel7 tabs
Free
Sheets + Excel5 tabs
Free