Annual Report
Docs + Word6 pages
FeaturedFree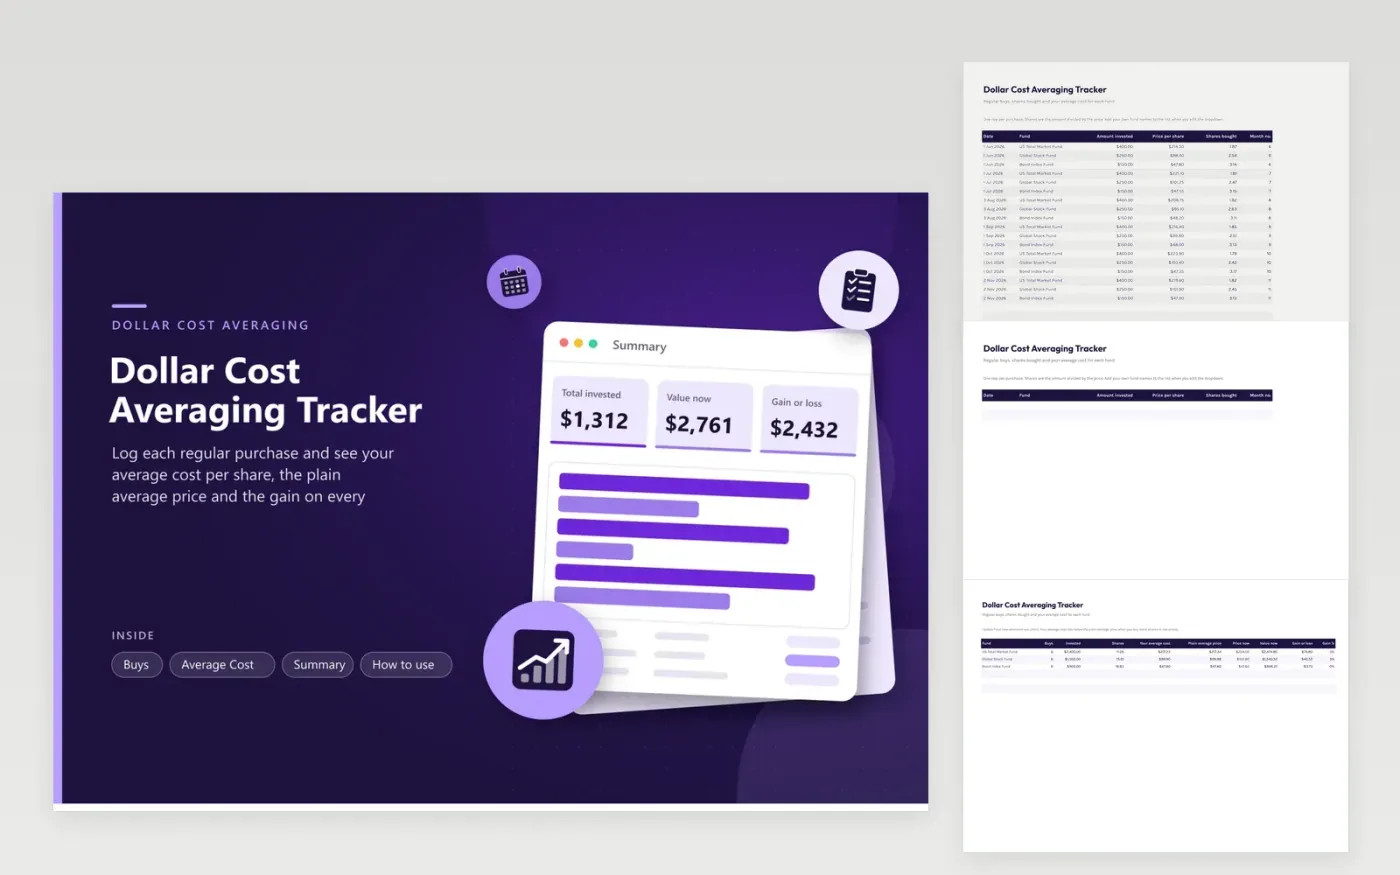
Buying the same dollar amount each month means you get more shares when the price falls and fewer when it rises. Every purchase goes on the Buys tab with a date, fund, amount and price, and the shares are calculated for you. The Average Cost tab adds buys, dollars invested, shares and your true average cost, and sets it beside the plain average of the prices you paid.
Type the price now for each fund and the sheet shows the value, the gain in dollars and the return. Summary charts invested money against value by fund and invested money by month. Sample buys run from June to November across a stock, a global and a bond fund; replace them and rename the funds in the dropdown.
Click Make a copy in Google Sheets, then confirm on the Google page. The copy is saved to your own Google Drive.
Start on the Buys tab: replace the sample rows with your own.
Keep the formula columns as they are; they fill in as you type.
Read the How to use tab for tips. For Excel, download the .xlsx file instead.
Divide the total dollars invested by the total shares owned. With equal monthly amounts, this is lower than the plain average of the prices whenever more shares were bought at lower prices.
It means investing a fixed amount at regular times instead of one lump sum. It spreads out the prices you pay but does not guarantee a gain or protect against loss.
Not separately. Add any fee to the amount invested if you want it to count in the average cost, and keep official statements for tax records.
Docs + Word6 pages
FeaturedFree
Excel
FeaturedFree
Sheets + Excel5 tabs
Free
Sheets + Excel6 tabs
Free
Sheets + Excel6 tabs
Free
Sheets + Excel5 tabs
Free
Sheets + Excel6 tabs
Free
Sheets + Excel7 tabs
Free
Sheets + Excel5 tabs
Free
Sheets + Excel5 tabs
Free
Sheets + Excel5 tabs
Free
Sheets + Excel5 tabs
Free
Sheets + Excel6 tabs
Free
Sheets + Excel7 tabs
Free
Sheets + Excel5 tabs
Free