Annual Report
Docs + Word6 pages
FeaturedFree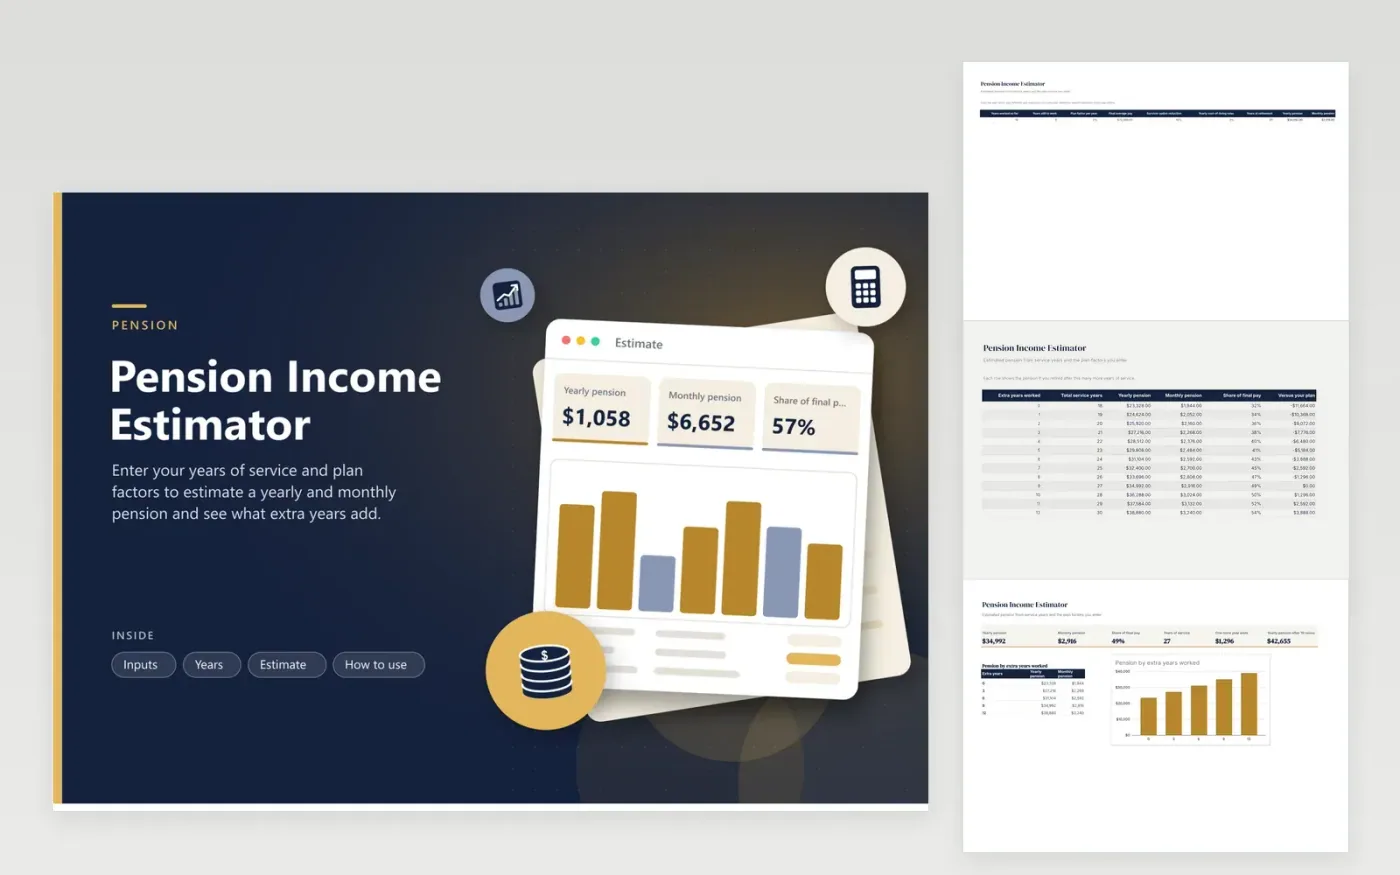
Many public and union pensions follow one idea: years of service times a percentage times final average pay. The Inputs tab takes those pieces from your benefit statement, along with a survivor option reduction and a yearly cost-of-living raise, and returns a yearly and monthly pension at your planned retirement date. Every factor is a cell you can change because plans differ.
The Years tab lists the same estimate for zero through twelve more years of work, with the share of final pay each would replace. The Estimate tab shows what one more year adds and what the pension becomes after ten raises, with a chart by extra years. Sample numbers describe 18 years worked and 9 to go at a 2 percent factor.
Click Make a copy in Google Sheets, then confirm on the Google page. The copy is saved to your own Google Drive.
Start on the Inputs tab: replace the sample rows with your own.
Keep the formula columns as they are; they fill in as you type.
Read the How to use tab for tips. For Excel, download the .xlsx file instead.
Most defined benefit plans multiply years of service by a percentage factor and by a pay figure, often an average of the last few years. Your plan booklet states the factor and how pay is defined.
With a simple factor, each extra year adds the factor times your average pay. The Years tab shows the dollar difference for each extra year using the figures you enter.
It lowers the monthly amount so a spouse keeps receiving payments after you die. The size of the reduction depends on the plan and ages, so enter the percentage from your plan statement.
Docs + Word6 pages
FeaturedFree
Excel
FeaturedFree
Sheets + Excel5 tabs
Free
Sheets + Excel6 tabs
Free
Sheets + Excel6 tabs
Free
Sheets + Excel5 tabs
Free
Sheets + Excel6 tabs
Free
Sheets + Excel6 tabs
Free
Sheets + Excel7 tabs
Free
Sheets + Excel5 tabs
Free
Sheets + Excel5 tabs
Free
Sheets + Excel5 tabs
Free
Sheets + Excel6 tabs
Free
Sheets + Excel7 tabs
Free
Sheets + Excel5 tabs
Free