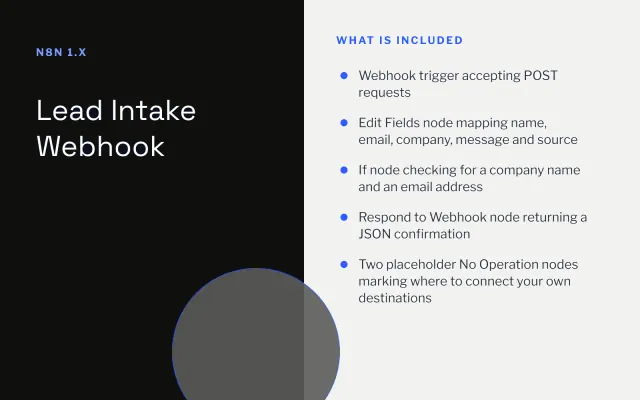
Lead Intake Webhook
n8n
FeaturedFree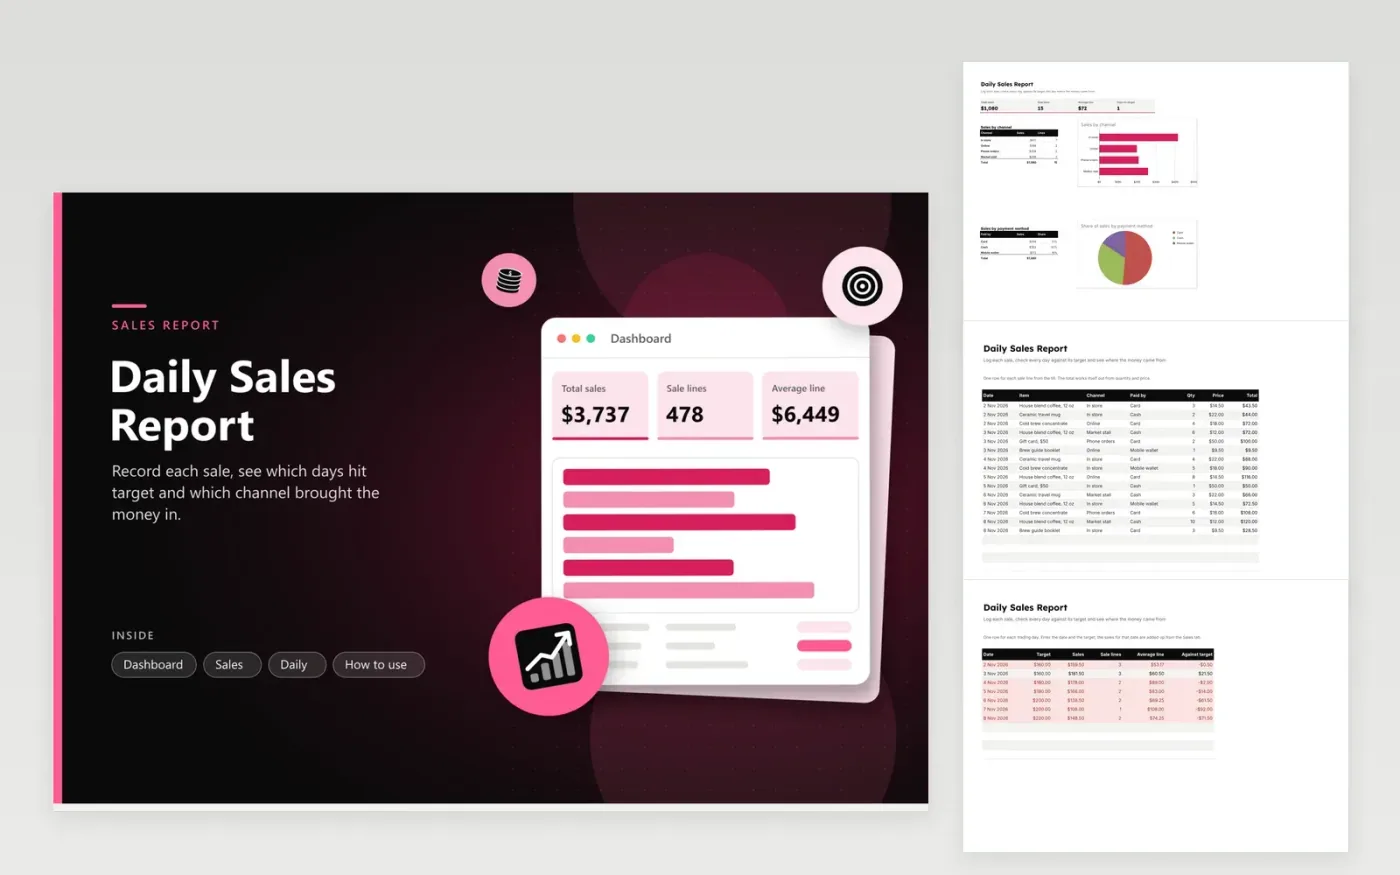
This report is for a shop, cafe or market stall that needs a clear view of each trading day. The Sales tab records every sale line with its date, item, channel, payment method, quantity and price, and the total calculates itself. The Daily tab adds up each date, counts the sale lines, works out the average line and shows how far the day landed from its target. The Dashboard summarizes sales by channel and by payment method.
Enter sales after every shift, or once a day from your till export. Set a realistic target for each date on the Daily tab, and leave the rows blank for days you are closed. A red row means that day finished below target. Check the channel breakdown each week to see which channel needs attention, and copy the file when a new month begins to keep the history.
Click Make a copy in Google Sheets, then confirm on the Google page. The copy is saved to your own Google Drive.
Start on the Sales tab: replace the sample rows with your own.
Keep the formula columns as they are; they fill in as you type.
Read the How to use tab for tips. For Excel, download the .xlsx file instead.
The average line is the total sales for a date divided by the number of sale lines for that date. It shows the typical value of one line on the till, so a quiet day with a few large orders can show a higher average than a busy day of small purchases.
Add the new name to the Channel or Paid by list on the Sales tab, then put it into the matching dashboard breakdown, spelled identically. Any difference in spelling leaves that channel showing zero.
Yes. Clear the Sales rows, keep only the date you need on the Daily tab, and enter that day's sales. The dashboard then shows that day's figures. Otherwise the totals cover every row on the Sales tab.
n8n
FeaturedFree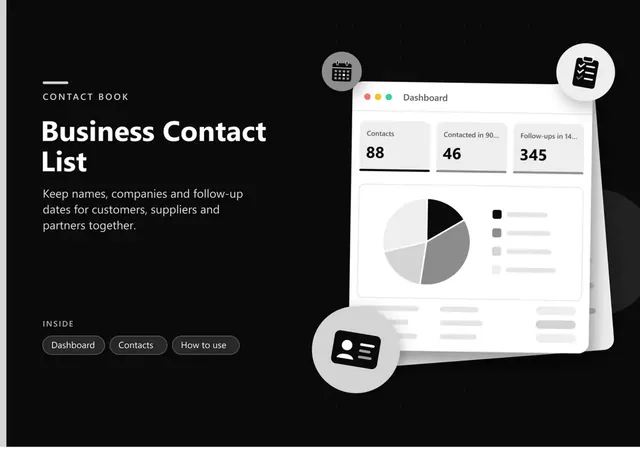
Sheets + Excel4 tabs
Free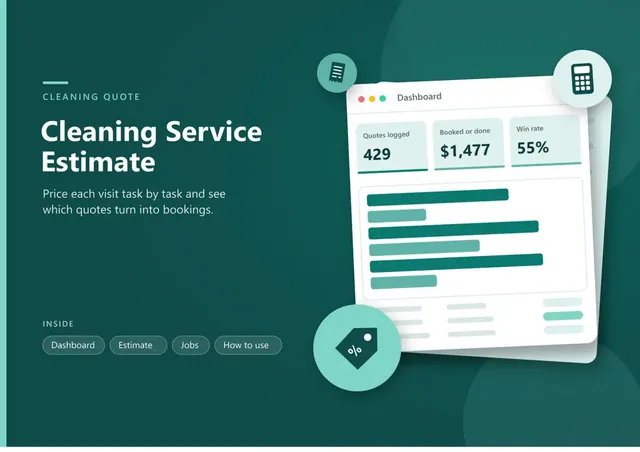
Sheets + Excel5 tabs
Free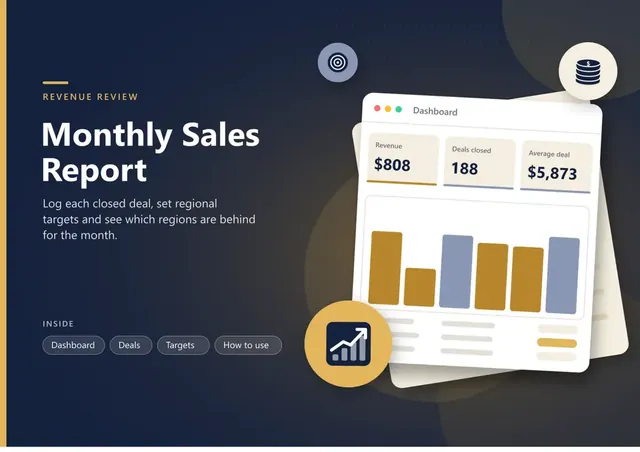
Sheets + Excel5 tabs
Free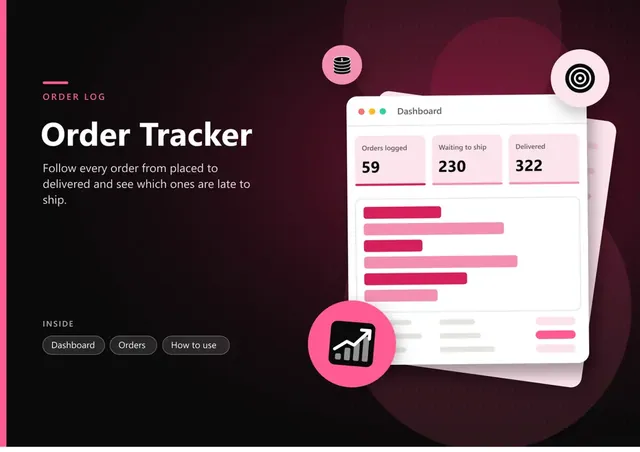
Sheets + Excel4 tabs
Free
Sheets + Excel5 tabs
Free
Sheets + Excel5 tabs
Free
Sheets + Excel4 tabs
Free
Sheets + Excel4 tabs
Free
Sheets + Excel4 tabs
Free