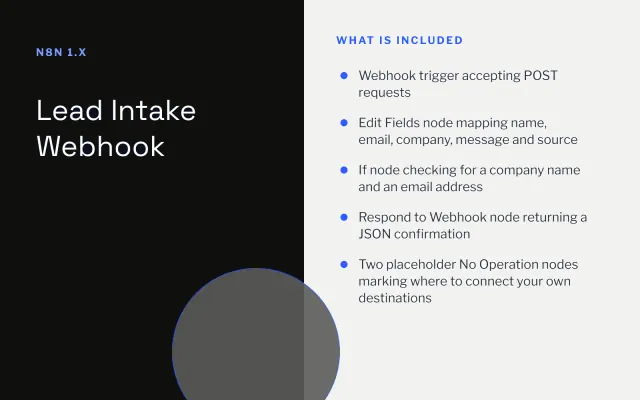
Lead Intake Webhook
n8n
FeaturedFree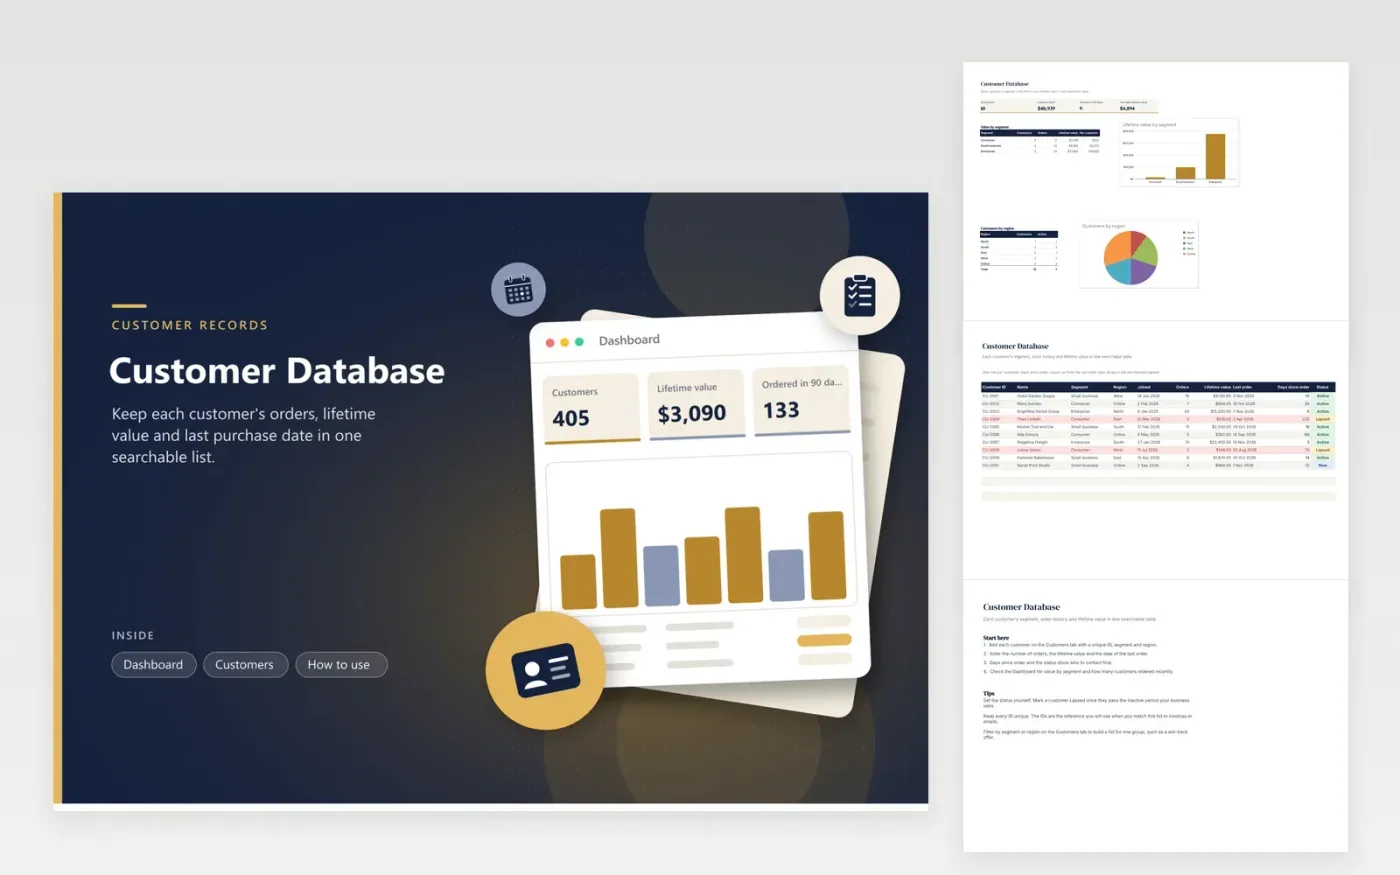
Sales and support teams use the Customer Database to see who buys and how much they spend. The Customers tab holds one row per customer with an ID, segment (Consumer, Small business or Enterprise), region, join date, order count, lifetime value, last order date and status. Days since order counts up from the last purchase. The Dashboard shows orders and lifetime value by segment, plus how many customers sit in each region.
Give every customer a unique ID and set the status to Lapsed once they pass the inactive period your business uses. Lapsed rows are shaded red, so a win-back mailing list is quick to pull. Update the orders and lifetime value after each sale, or paste monthly totals from your sales system. Filter by segment or region to build a list for one group.
Click Make a copy in Google Sheets, then confirm on the Google page. The copy is saved to your own Google Drive.
Start on the Customers tab: replace the sample rows with your own.
Keep the formula columns as they are; they fill in as you type.
Read the How to use tab for tips. For Excel, download the .xlsx file instead.
Lifetime value is the total you have earned from a customer so far, usually the sum of their orders less refunds. Type it in from your sales records, since this sheet does not link to them. Use the same definition for every customer so the segment totals compare.
That depends on how often your customers buy. Many businesses use 90, 180 or 365 days. Choose a period that fits your buying cycle, then mark customers as Lapsed once they pass it.
This template keeps one row per customer with running totals. For order-by-order records, add a second tab with one row per order and the customer ID. Keep the totals on this tab in step with that log.
n8n
FeaturedFree
Sheets + Excel4 tabs
Free
Sheets + Excel5 tabs
Free
Sheets + Excel4 tabs
Free
Sheets + Excel5 tabs
Free
Sheets + Excel4 tabs
Free
Sheets + Excel4 tabs
Free
Sheets + Excel4 tabs
Free
Sheets + Excel3 tabs
Free
Sheets + Excel4 tabs
Free