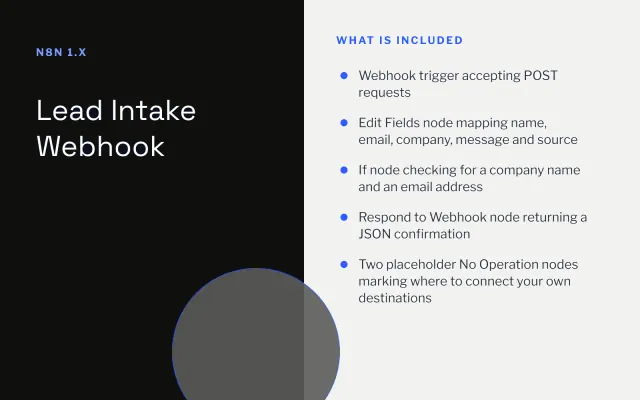
Lead Intake Webhook
n8n
Free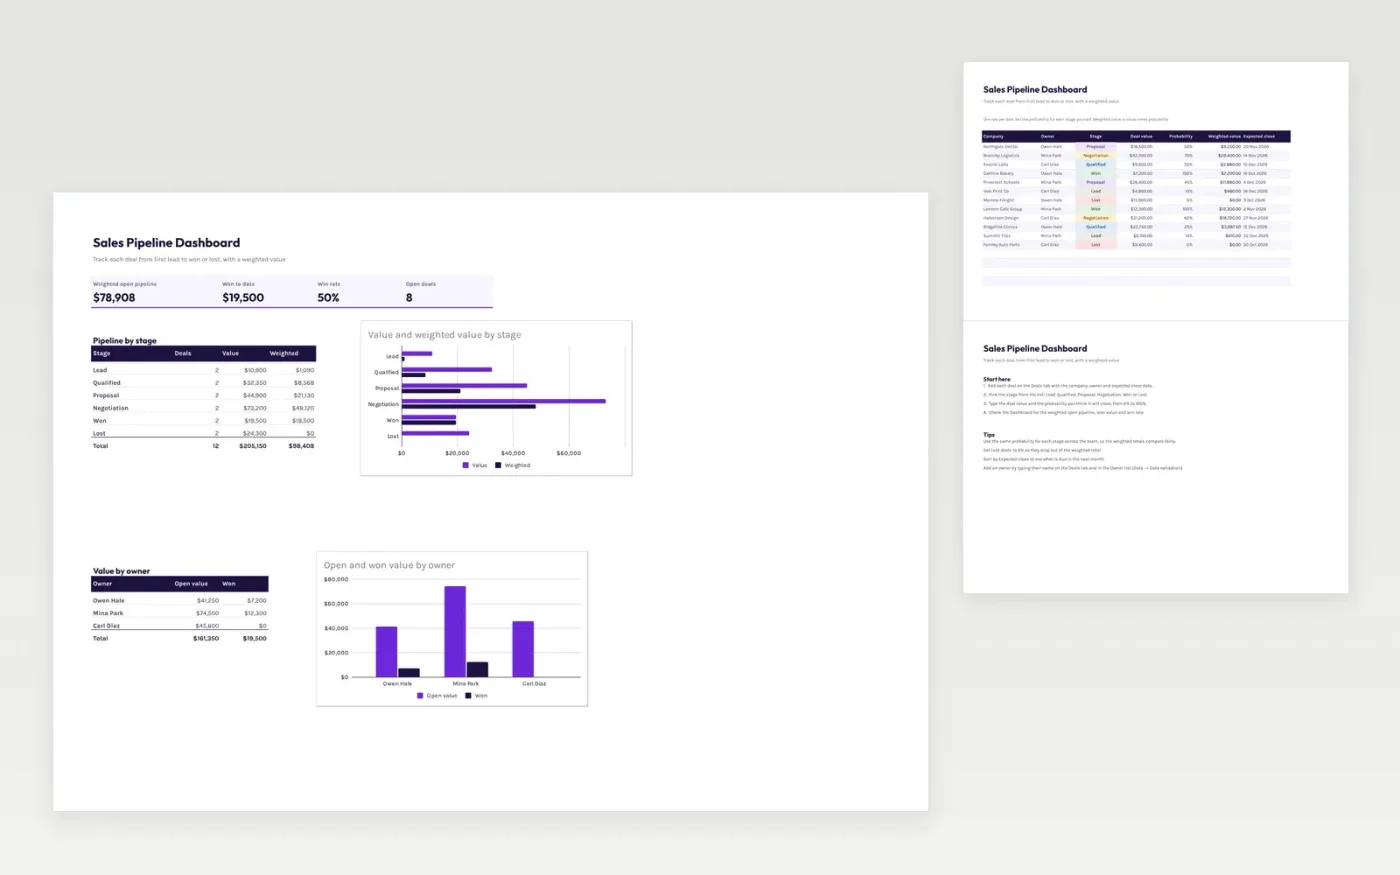
The Sales Pipeline Dashboard follows each deal from first lead through qualification, proposal and negotiation to won or lost. The Deals tab records the company, owner, stage, deal value, your probability for the deal and the expected close date. Weighted value is worked out from value and probability. The Dashboard shows the weighted open pipeline, won value, win rate and charts by stage and by owner.
The file comes with sample data for twelve deals, so you can see how it works. Make a copy, replace the sample rows with your own deals, and the totals, win rate and charts update on their own.
Click Make a copy in Google Sheets, then confirm on the Google page. The copy is saved to your own Google Drive.
Start on the Deals tab: replace the sample rows with your own.
Keep the formula columns as they are; they fill in as you type.
Read the How to use tab for tips. For Excel, download the .xlsx file instead.
Yes. The Sales Pipeline Dashboard template is free to download, copy and use for your own sales team.
Yes. Download the .xlsx file and open it in Microsoft Excel. The formulas, dropdowns, colour-coded stages and charts work in Excel as well as in Google Sheets.
Weighted value is the deal value multiplied by its probability. You set the probability for each deal, from 0% to 100%. The dashboard adds up the weighted value of open deals only.
n8n
Free
Slides + PowerPoint12 slides
Free
Docs + Word3 pages
Free
Sheets + Excel4 slides
Free
Sheets + Excel4 slides
Free