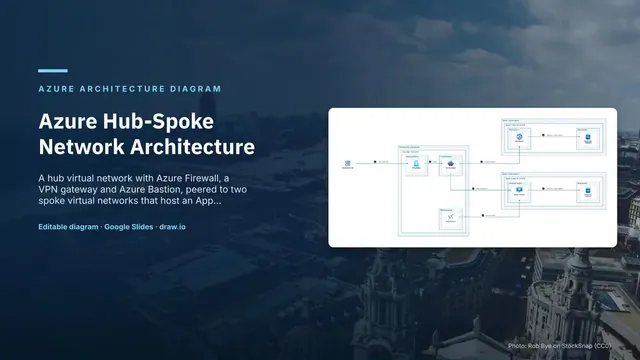
Azure Hub-Spoke Network Architecture
Slides + PowerPoint5 slides
Free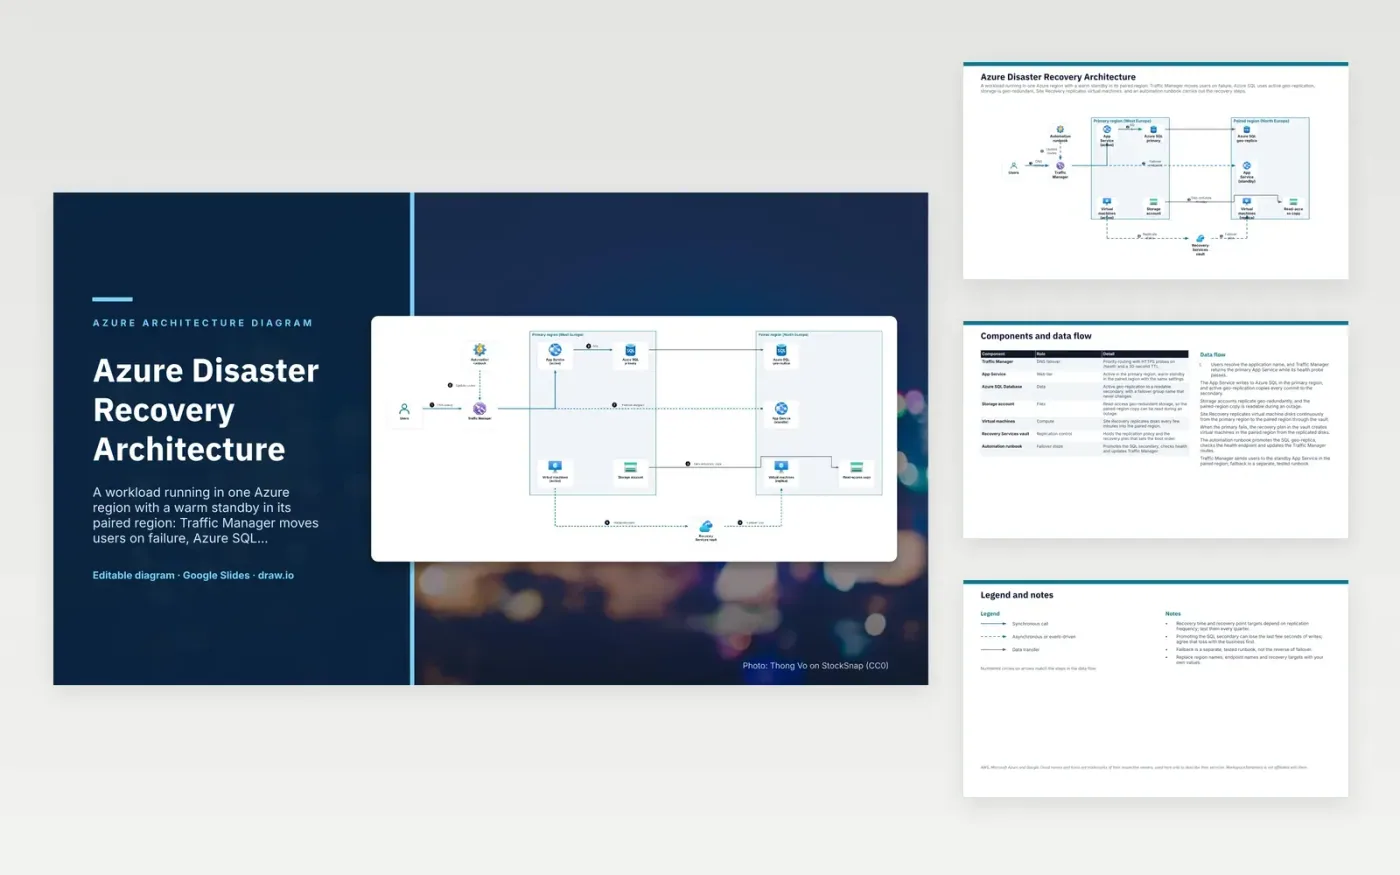
Traffic Manager returns the primary App Service to users while its HTTPS health probe passes. The App Service writes to Azure SQL in the primary region, and active geo-replication copies each commit to a secondary. Storage accounts replicate geo-redundantly, and Site Recovery copies virtual machine disks to the paired region through a Recovery Services vault. When the primary fails, the automation runbook promotes the SQL secondary, checks health and updates the Traffic Manager routes.
The design point is the trade-off between data loss and cost. Promoting the SQL secondary can lose the last few seconds of writes, so the business must accept that loss before go-live. The standby App Service is scaled down to save cost but keeps the same settings. Failback is a separate, tested runbook, not the reverse of failover. To adapt it, set replication frequency and recovery targets to your own requirements, and test both paths every quarter.
The diagram uses the official Microsoft Azure architecture icons, each labelled with its service name. AWS, Microsoft Azure and Google Cloud names and icons are trademarks of their respective owners, used here only to describe their services. WorkspaceTemplates is not affiliated with them.
Click Make a copy in Google Slides, then confirm on the Google page. The copy is saved to your own Google Drive.
Rename Users, Traffic Manager, Automation runbook and the other boxes inside Primary region (West Europe) to your own components, and delete the ones your system does not have.
Rewrite the 7-step data flow and the 7-row components table so they match the arrows you keep.
For the draw.io version, download azure-disaster-recovery-architecture-diagram.drawio and open it at app.diagrams.net.
The failover group provides a listener name that applications connect to. After failover, that name points at the new primary, so connection strings do not have to change.
Geo-redundant storage (GRS) copies data to a paired region. Read-access GRS (RA-GRS) also allows reads from that secondary copy, so the data can be read during an outage without a failover.
The amount depends on the replication policy and the recovery points it keeps, so the recovery point target should be measured in a test rather than assumed. Azure-to-Azure replication copies disk changes continuously.
More Google Slides templatesMore developer workflows templates
Slides + PowerPoint5 slides
Free
Slides + PowerPoint5 slides
Free
Slides + PowerPoint5 slides
Free
Slides + PowerPoint5 slides
Free
Slides + PowerPoint5 slides
Free
Slides + PowerPoint5 slides
Free
Slides + PowerPoint5 slides
Free
Slides + PowerPoint5 slides
Free