Annual Report
Docs + Word6 pages
FeaturedFree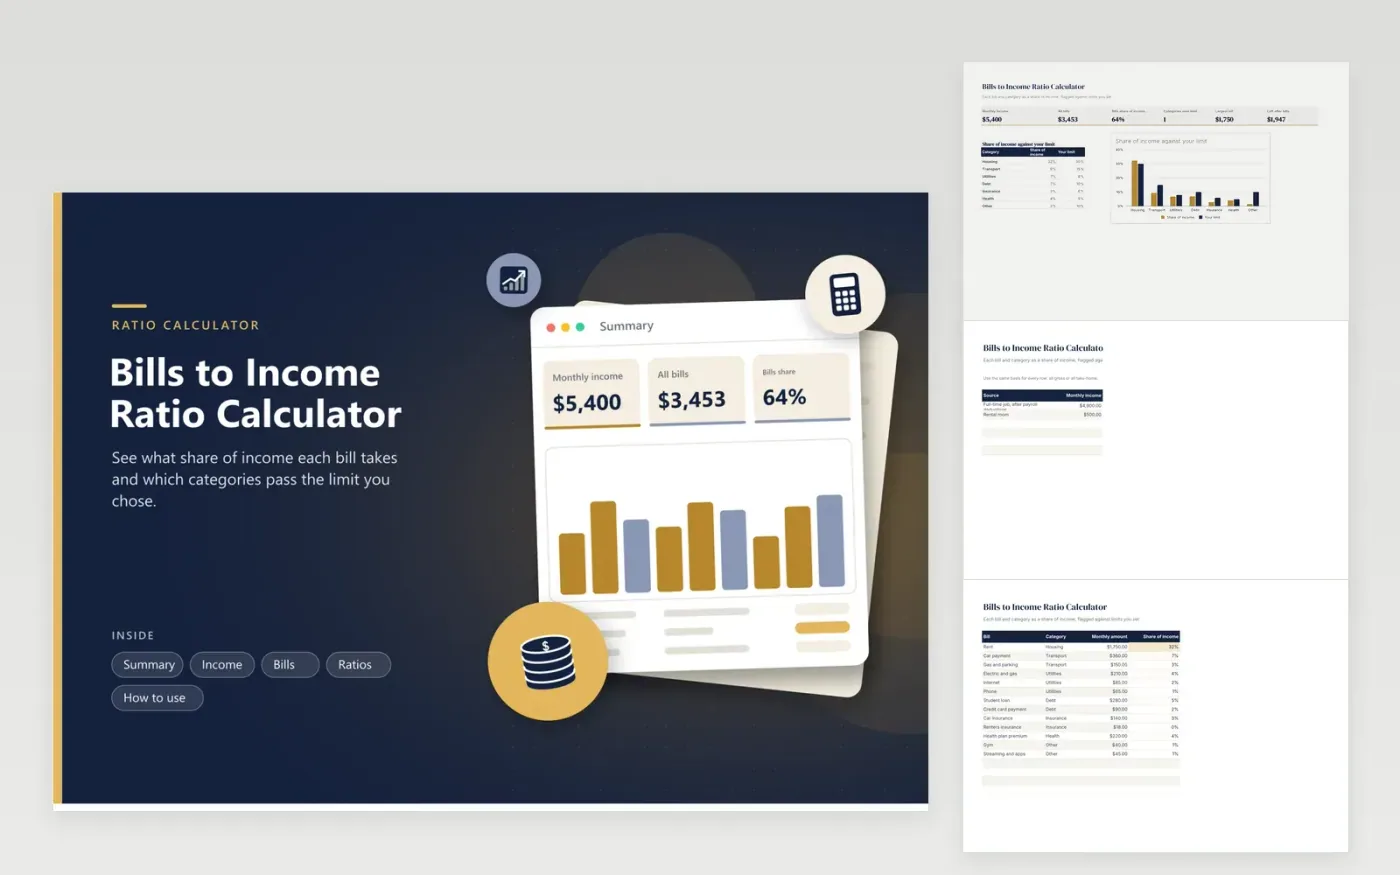
A bill can feel small until you compare it with income. This calculator divides each bill by your monthly income and shows the share beside it, with a colour scale that darkens as the share grows. The Ratios tab groups the bills by category, such as housing, transport and debt, and compares each group with a limit you type in yourself.
Categories over their limit are marked and highlighted, and the Summary counts them and charts every share against its limit. Sample rows describe a household earning $5,400 a month where rent alone is above a thirty percent limit. The limits are inputs, not rules, so change them to match what your household can carry. Use gross or take-home pay for every row, not a mix.
Click Make a copy in Google Sheets, then confirm on the Google page. The copy is saved to your own Google Drive.
Start on the Income tab: replace the sample rows with your own.
Keep the formula columns as they are; they fill in as you type.
Read the How to use tab for tips. For Excel, download the .xlsx file instead.
Add your monthly bills and divide by monthly income. This sheet does it for the whole set and for each bill and category.
There is no single answer. Lenders and counselors use different measures, so the Ratios tab lets you pick your own limit for each category.
Either works if every row uses the same basis. Net pay reflects what you can spend, while gross pay matches how some lenders measure ratios.
Docs + Word6 pages
FeaturedFree
Excel
FeaturedFree
Sheets + Excel5 tabs
Free
Sheets + Excel6 tabs
Free
Sheets + Excel6 tabs
Free
Sheets + Excel6 tabs
Free
Sheets + Excel5 tabs
Free
Sheets + Excel6 tabs
Free
Sheets + Excel6 tabs
Free
Sheets + Excel7 tabs
Free
Sheets + Excel7 tabs
Free
Sheets + Excel6 tabs
Free
Sheets + Excel6 tabs
Free
Sheets + Excel5 tabs
Free
Sheets + Excel6 tabs
Free