Annual Report
Docs + Word6 pages
FeaturedFree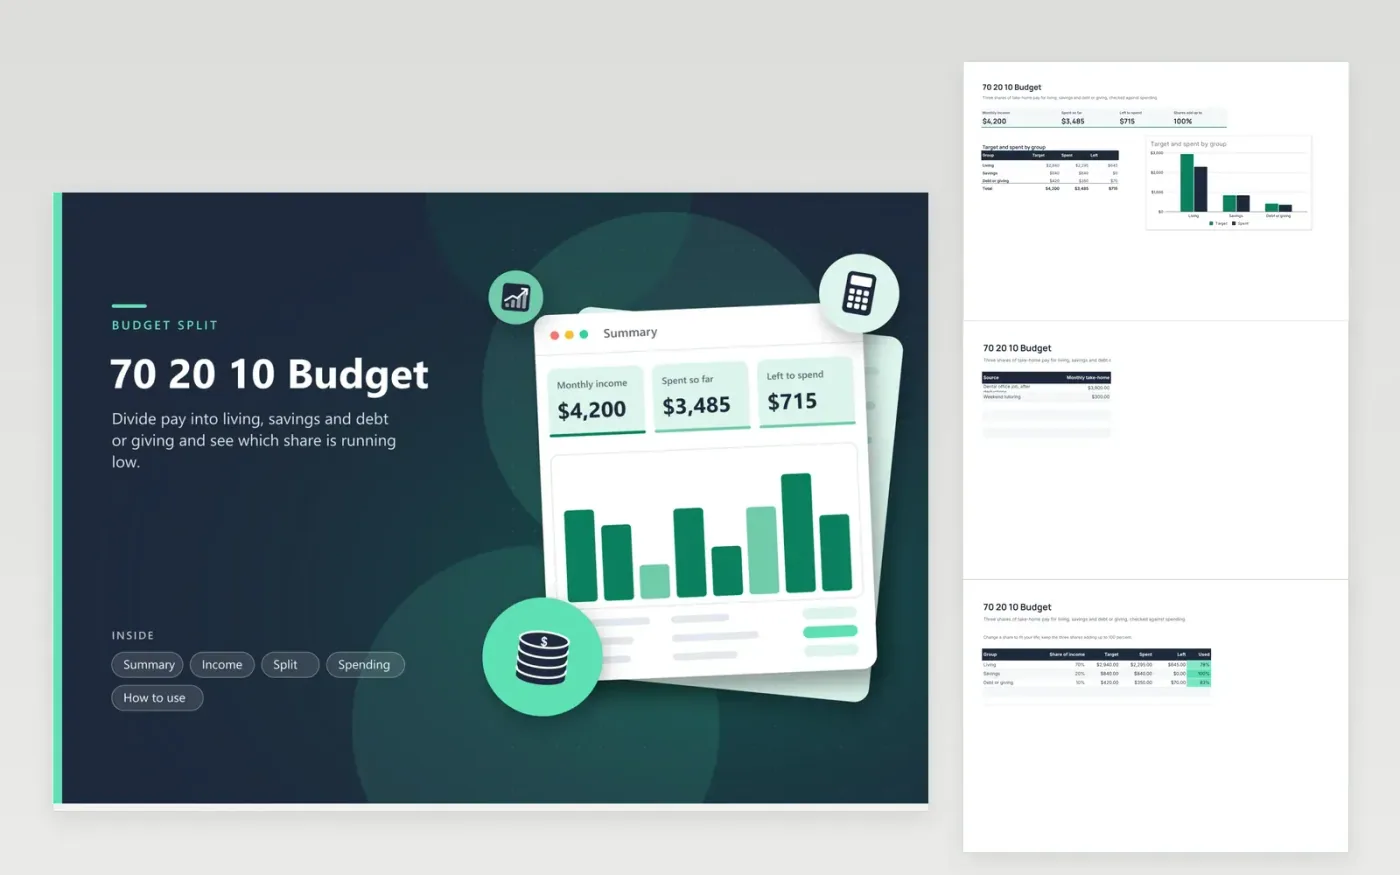
A 70 20 10 budget keeps the decision small. Seventy percent of take-home pay covers living costs, twenty percent goes to savings and ten percent goes to debt payoff or giving. This sheet turns those shares into dollar targets and compares each with what you actually spent, so you see which group has room left.
The shares sit in editable cells. If housing is heavy or a debt needs more attention, change the percentages and the targets follow. A used percentage with a colour scale shows the groups closest to their limits. Sample rows describe a month with rent, an emergency fund transfer and a charity gift; overwrite them as your own month goes.
Click Make a copy in Google Sheets, then confirm on the Google page. The copy is saved to your own Google Drive.
Start on the Income tab: replace the sample rows with your own.
Keep the formula columns as they are; they fill in as you type.
Read the How to use tab for tips. For Excel, download the .xlsx file instead.
Seventy percent of take-home pay for living, twenty percent for savings and ten percent for debt repayment or giving. Treat it as a guideline, not a requirement.
Yes. Edit the share cells on the Split tab. Keep them adding up to 100 percent; the Summary shows the current total.
Net pay, the money that arrives in your account. The shares then describe what you can actually spend and save.
Docs + Word6 pages
FeaturedFree
Excel
FeaturedFree
Sheets + Excel5 tabs
Free
Sheets + Excel6 tabs
Free
Sheets + Excel6 tabs
Free
Sheets + Excel5 tabs
Free
Sheets + Excel6 tabs
Free
Sheets + Excel6 tabs
Free
Sheets + Excel6 tabs
Free
Sheets + Excel7 tabs
Free
Sheets + Excel7 tabs
Free
Sheets + Excel6 tabs
Free
Sheets + Excel6 tabs
Free
Sheets + Excel5 tabs
Free
Sheets + Excel6 tabs
Free