Board Technology Update
Slides + PowerPoint11 slides
Free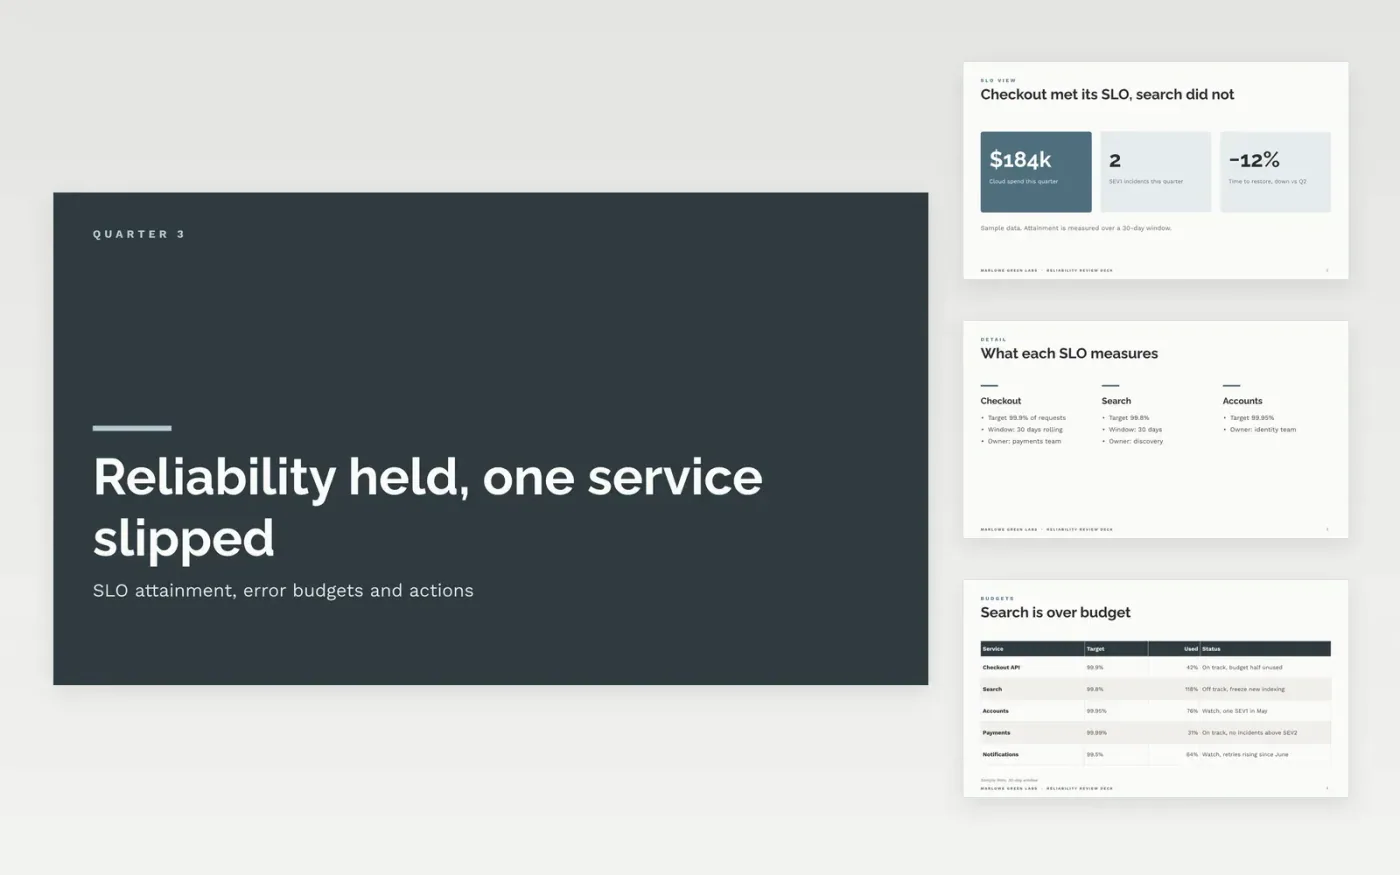
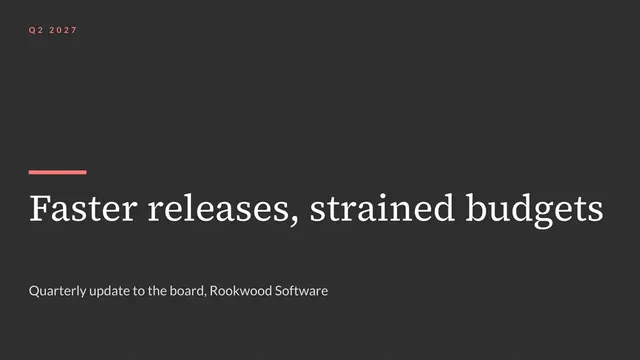
Engineering leaders need to know whether delivery is getting faster and safer, and SRE teams need to see where reliability is slipping before customers notice. This deck brings those views together: the SLO overview, the error budget each service has used, the incidents behind any spend and the actions for the next period. Each slide labels what was measured and what is judgement, so the trend can carry the message.
The sample reviews five services over one quarter, with 99.94% attainment on the checkout API, two SEV1 incidents and a time to restore that fell by 12%. Replace the services, targets, budgets and incidents with your own data, name the data source on the first slide, and keep the action list to three items, each with an owner.
Click Make a copy in Google Slides, then confirm on the Google page. The copy is saved to your own Google Drive.
Replace the four headline figures with your last four quarters of data, and name the data source on the first slide.
Update the error budget table with your services, targets and budget used, then flag any service that is off track.
Link each incident to its postmortem, and drop any incident below your severity threshold.
Delete the guide slide, then share the deck with engineering leadership or present it at the review.
No. Marlowe Green Labs, the services, the people named, the SLO targets and every incident in the deck are fictional sample data. Replace them with your own monitoring and incident records before you present the deck.
State the window, the event definition and the data source on each slide, for example a 30-day rolling window over successful checkout requests. Medians and p90 values show the spread better than averages, which can hide a long tail.
No. The review should show team and service trends rather than rank people, because named comparisons change how people behave. Name the owning team on each action and keep commentary to what the data supports.
More Google Slides templatesMore developer workflows templates
Slides + PowerPoint11 slides
Free
Slides + PowerPoint10 slides
Free
Slides + PowerPoint10 slides
Free
Docs + Word7 pages
Free
Docs + Word8 pages
Free
Slides + PowerPoint10 slides
Free
Docs + Word8 pages
Free