Engineering Metrics Deck
Slides + PowerPoint10 slides
Free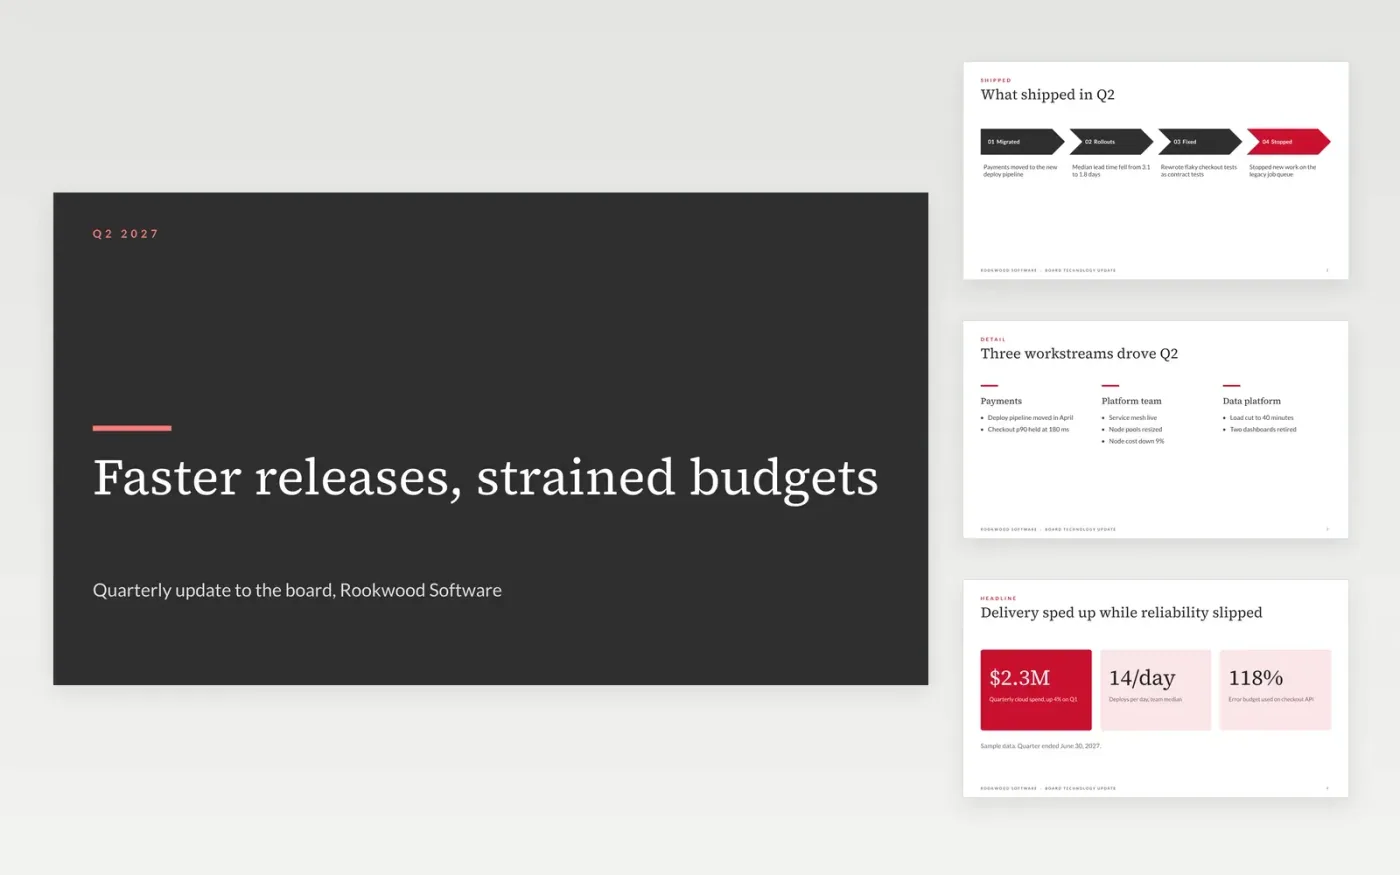
Quarterly board updates on engineering tend to drift into anecdotes, so directors cannot tell whether delivery is improving or whether reliability is paying for it. This template gives CTOs a fixed structure: highlights, delivery metrics in DORA terms, SLO attainment and error budgets, incidents and time to restore, quality, people, risks, and next-quarter actions. Each figure sits beside its target and its prior period, so the trend carries the message.
The sample covers Rookwood Software's second quarter of 2027 for a payments and checkout platform. Every number is sample data, and the deck marks which lines are measurements and which are judgments. To adapt it, replace the four headline DORA figures with your last four quarters and name the data source, set a target for each metric, update the SLO table with your services, then keep actions to three, each with an owner.
Click Make a copy in Google Slides, then confirm on the Google page. The copy is saved to your own Google Drive.
Replace the four headline DORA figures on the metrics slides with your last four quarters, naming the data source.
Set a target for each KPI, flag any that are off track, and update the SLO table with your services.
Link each incident to its postmortem, drop incidents below your severity threshold, and keep actions to three.
Delete the guide slide, then share the deck or present it from Google Slides.
No. Rookwood Software, its people and every figure in the deck are fictional sample data. Replace them with your own measurements before you present to a board.
Write down the data source and the calculation for each metric, such as deploy frequency from your pipeline log and lead time from first commit to production. Use medians and p90 rather than averages, which hide a long tail.
Yes, the slides are standard Google Slides layouts, so you can duplicate, reorder or delete any slide. Keep the metrics, scorecard and risk table together so reliability and delivery stay visible side by side.
More Google Slides templatesMore developer workflows templates
Slides + PowerPoint10 slides
Free
Slides + PowerPoint11 slides
Free
Docs + Word7 pages
Free