Engineering Health Survey Report
Docs + Word8 pages
Free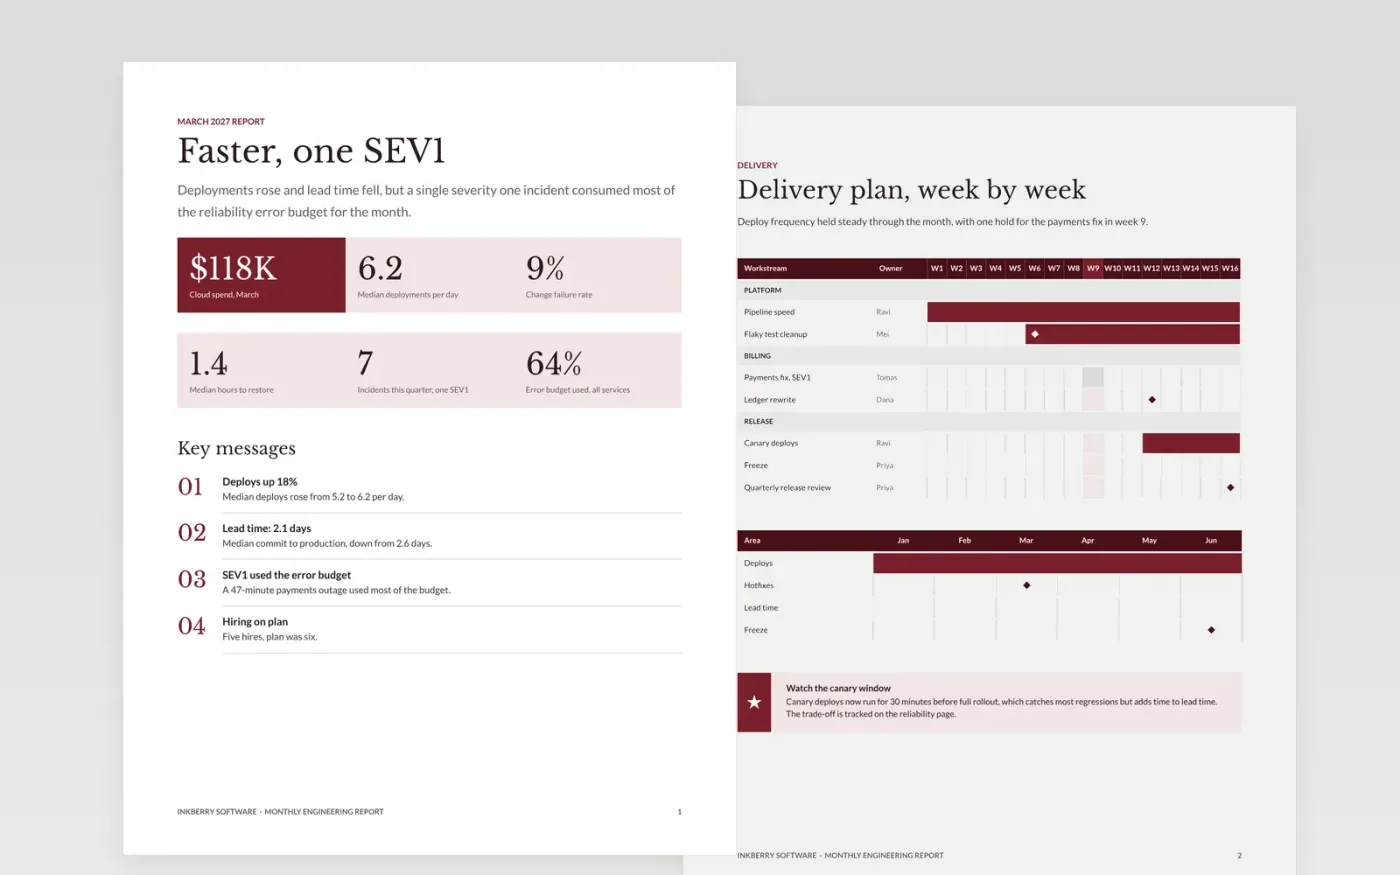
Engineering leaders get plenty of opinion and very little trend data, so reports drift toward whatever happened most recently. This template keeps the same structure every month: highlights, delivery in DORA terms, reliability against SLOs, incidents, team health, hiring and the risks. Each section pairs a figure with its target and its prior period, so the direction of travel is visible at a glance.
The sample is the March 2027 report for Inkberry Software, a fictional software company. It shows six deploys a day, a 9% change failure rate and a payments outage that used most of the error budget. It includes a delivery Gantt, a reliability scorecard, a team directory, hiring owners and a heatmap of three risks. Replace the figures, sources and names with your own before the report goes to the VP.
Click Make a copy in Google Docs, then confirm on the Google page. The copy is saved to your own Google Drive.
Replace the headline DORA figures with your last four quarters, naming the data source.
Set targets for each metric in the scorecards, then flag the ones that are off track.
Update the SLO table, link each incident to its postmortem and limit actions to three.
Delete the guide page, then send the report to the VP or present it at the leadership review.
No. Inkberry Software, the people in the directory, the incidents and every metric are fictional sample data, so replace them with your own before the report goes out.
An average can hide a long tail, where a few slow changes or long outages distort the picture. Medians and the 90th percentile show the typical case and the worst common case, which is what engineering leaders need to act on.
No. Report team-level trends and never rank individual developers by output, because ranking changes the behavior the numbers are meant to measure. Names belong only in the directory and against risk owners.
More Google Docs templatesMore developer workflows templates
Docs + Word8 pages
Free
Docs + Word7 pages
Free
Slides + PowerPoint10 slides
Free
Slides + PowerPoint10 slides
Free
Slides + PowerPoint10 slides
Free
Slides + PowerPoint10 slides
Free
Slides + PowerPoint11 slides
Free