Board Technology Update
Slides + PowerPoint11 slides
Free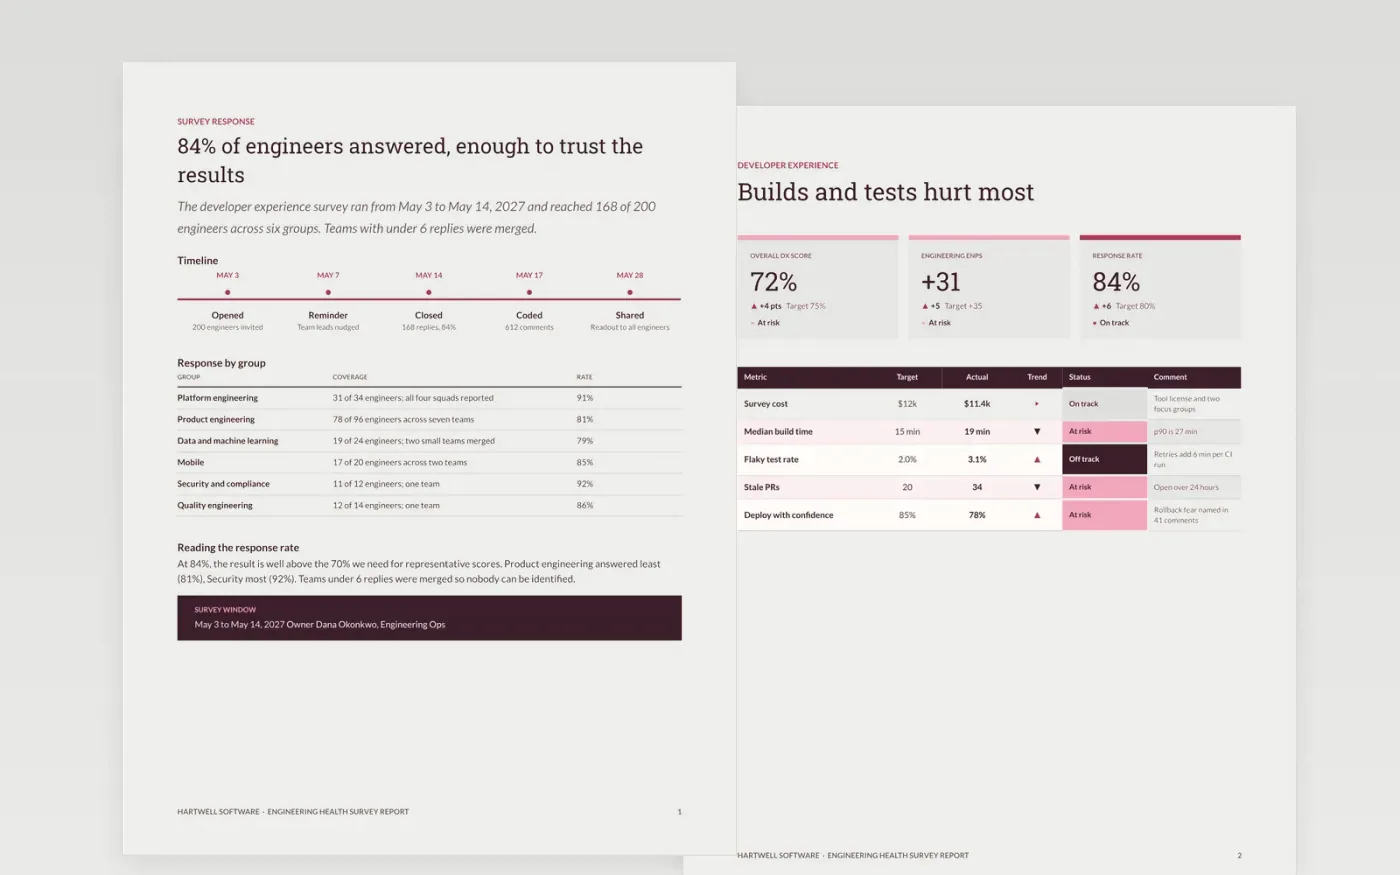
Engineering managers run developer experience surveys, then struggle to turn scores and hundreds of comments into something leadership will act on. This report sets out the response rate first, then scores against targets, comment themes, quotes, a glossary and an action plan with owners and dates.
The sample follows Hartwell Software, a fictional company where 168 of 200 engineers replied. It shows an eNPS of +31, build time and flaky tests as the top pain points, and six actions with a Gantt view through September. Replace the survey dates, scores, themes, quotes and owners with your own results.
Click Make a copy in Google Docs, then confirm on the Google page. The copy is saved to your own Google Drive.
Replace the survey dates, the number invited and the replies by group, and state how the survey was run.
Overwrite the scores, targets and trends with your results, and rewrite the themes from your coded comments.
Choose no more than three main actions, give each one owner and date, and update the Gantt view and checklist.
Delete the guide page, then share the report with engineering leaders and every team that took part.
Set a minimum number of replies before you report a group, such as 6, and merge smaller teams with a neighboring one. Never quote a comment that names a person.
No. Hartwell Software, the named people, the email addresses and every score, quote and date are fictional sample content. Replace them with your own before sharing.
Yes. The scorecard and action pages work for any engineering metric. Swap the survey measures for deployment frequency, lead time, change failure rate and time to restore.
More Google Docs templatesMore developer workflows templates
Slides + PowerPoint11 slides
Free
Slides + PowerPoint11 slides
Free
Docs + Word7 pages
Free