Engineering Metrics Deck
Slides + PowerPoint10 slides
Free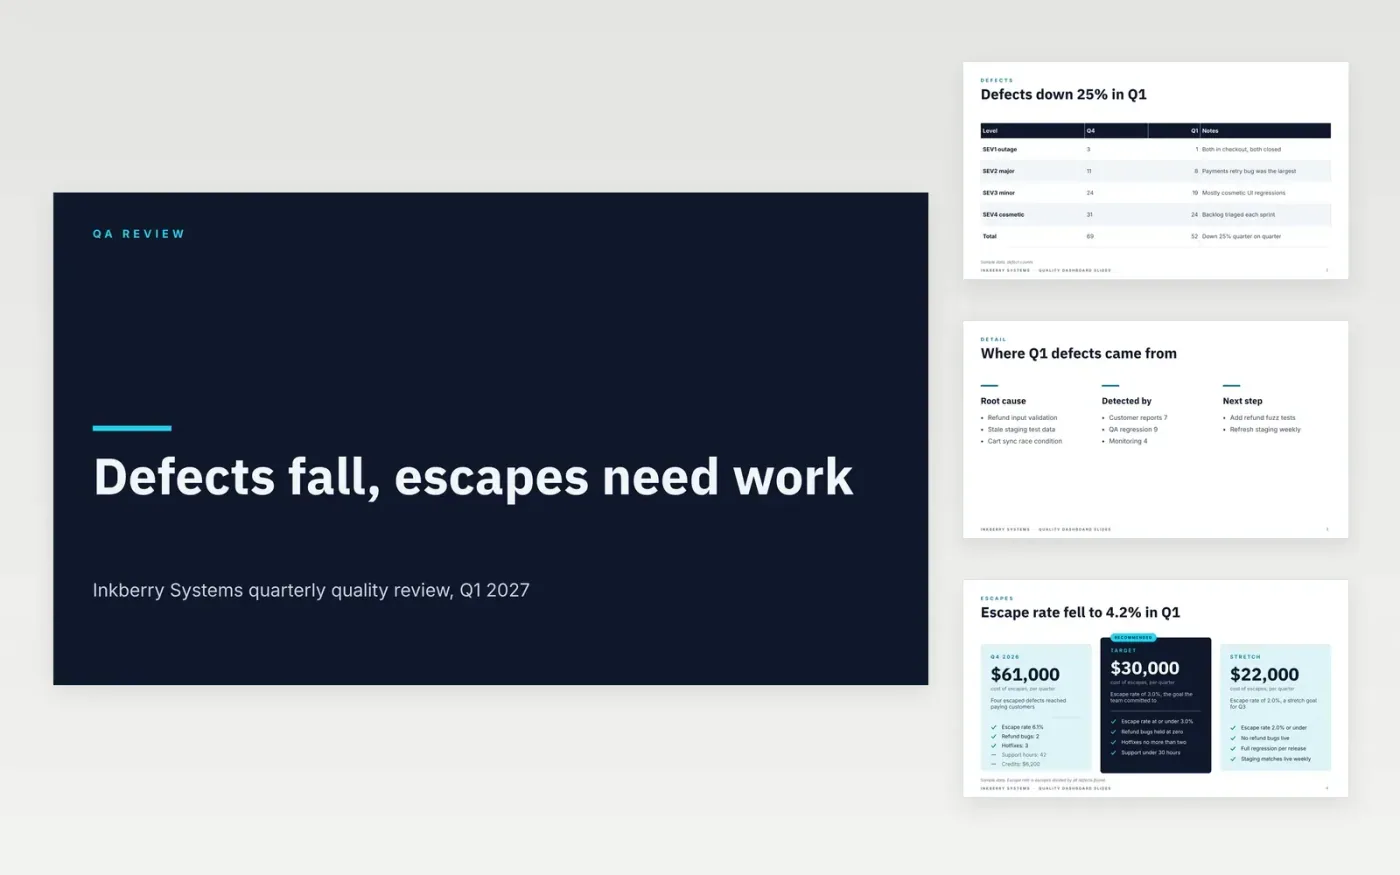
QA leads use this deck to report defect and test health to engineering leadership without relying on opinion. It moves from a defect table to escape rate, coverage and flaky tests, then closes with a short list of actions and owners. Each slide answers one question in a single view, so a reader can scan the deck in about ten minutes and still see the trend behind each number.
The sample is for Inkberry Systems, a fictional software company, and every figure and name in it is sample data. It shows defects down 25% in Q1, an escape rate of 4.2% and unit coverage at 84%. Replace the headline numbers with your last four quarters of data, state the source of each one, set a target for every metric, and cut any commentary you cannot support with figures.
Click Make a copy in Google Slides, then confirm on the Google page. The copy is saved to your own Google Drive.
Replace the four headline figures with your last four quarters of data, and name the source beside each one.
Set a target for each metric in the escape rate and coverage slides, and flag any figure that is off track.
Limit the actions to three, each with an owner and a date, and drop any commentary you cannot support with data.
Delete the guide slide, then share the deck with the VP of engineering or present it from Google Slides in the review.
No. Inkberry Systems, its people and every metric in this deck are fictional sample data, included so you can see how a quality review reads when it is complete.
Report medians and 90th percentile times rather than averages, since averages can hide a long tail. Say how each figure was measured, and show the prior period beside it so the trend is visible.
No. Report by team and by service, because tracking individual output tends to distort how people work and makes the numbers less honest.
More Google Slides templatesMore developer workflows templates
Slides + PowerPoint10 slides
Free
Slides + PowerPoint11 slides
Free
Slides + PowerPoint10 slides
Free
Docs + Word7 pages
Free
Slides + PowerPoint10 slides
Free
Docs + Word8 pages
Free
Docs + Word8 pages
Free