Engineering Metrics Deck
Slides + PowerPoint10 slides
Free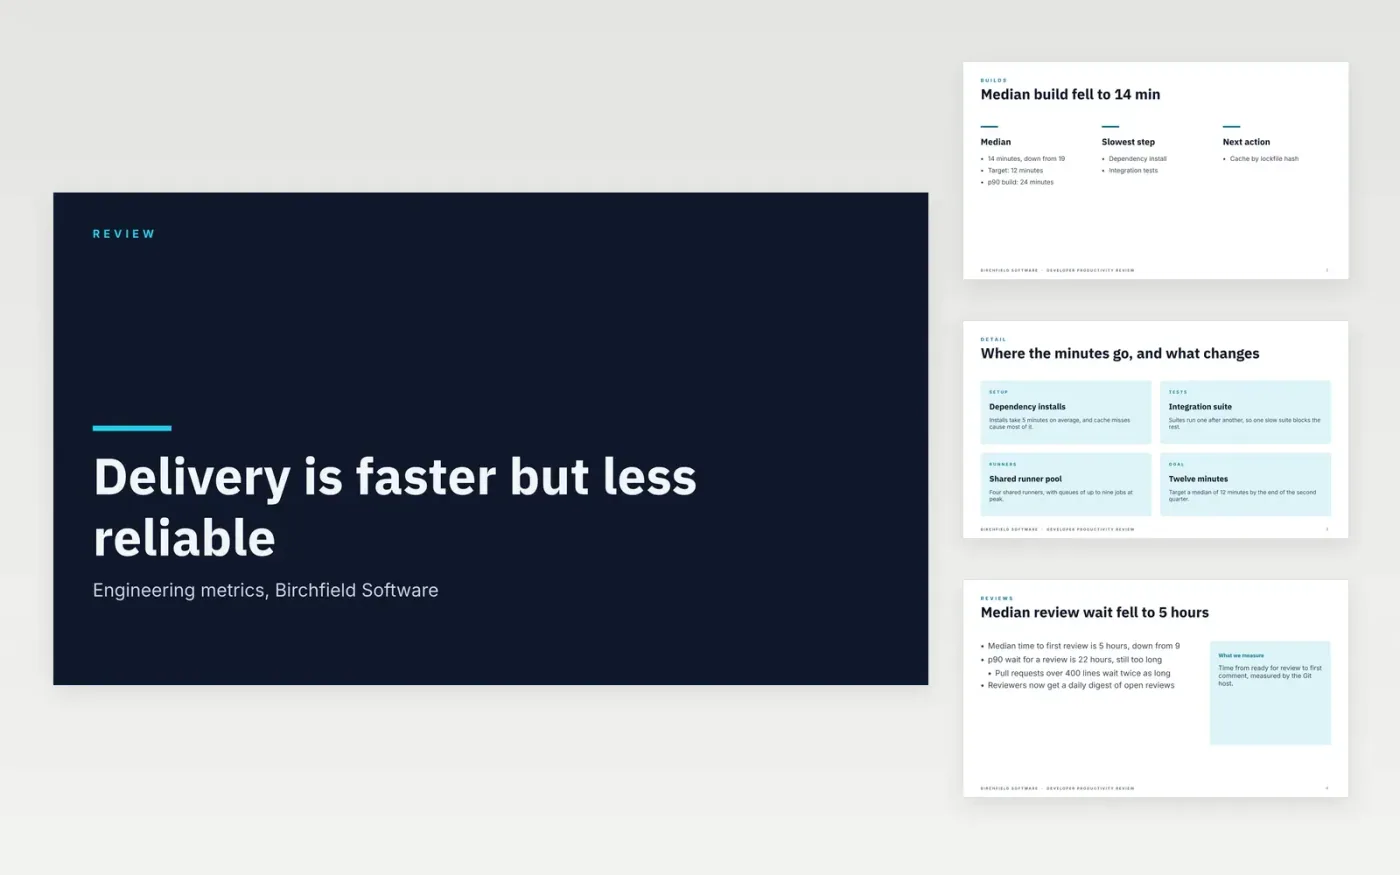
Engineering leaders need to know whether delivery is getting faster and whether reliability is slipping, yet most reviews answer both questions with opinion. This deck replaces opinion with trends: build times, review waits, survey scores and results, each shown against a target or the prior period. The slides follow the order a leadership team reads them, starting with the headline, then the evidence, then the bets and what they should achieve.
The sample covers Birchfield Software for one quarter, using medians and 90th percentiles rather than averages, a chart of survey scores and a matrix of improvement bets. Every figure matches across the slides. Replace the headline numbers with your own four quarters of data, state where each one comes from, set the targets, and keep actions to three, each with a named owner.
Click Make a copy in Google Slides, then confirm on the Google page. The copy is saved to your own Google Drive.
Replace the four headline figures with your last four quarters of data and name the source.
Set a target for each metric, and flag any that are off track in the results.
Link each incident to its postmortem, and drop incidents below your severity threshold.
Delete the guide slide, then share the deck with leaders or present it at the review.
Use medians and 90th percentiles for anything with a long tail, such as build and review times, and say so on the slide. Averages hide the slow cases that cause most of the frustration.
No. The organisation, people, email addresses and every figure are fictional sample data, set in a plausible range for a UK software team. Replace them with your own measured numbers before you share the deck.
No. The deck reports team-level trends only, because individual output figures distort behaviour and invite unfair comparisons. Keep survey results anonymous and report them by team.
More Google Slides templatesMore developer workflows templates
Slides + PowerPoint10 slides
Free
Slides + PowerPoint11 slides
Free
Slides + PowerPoint10 slides
Free
Docs + Word7 pages
Free
Docs + Word8 pages
Free
Slides + PowerPoint10 slides
Free
Docs + Word8 pages
Free