Project Plan Presentation
Slides + PowerPoint11 slides
Free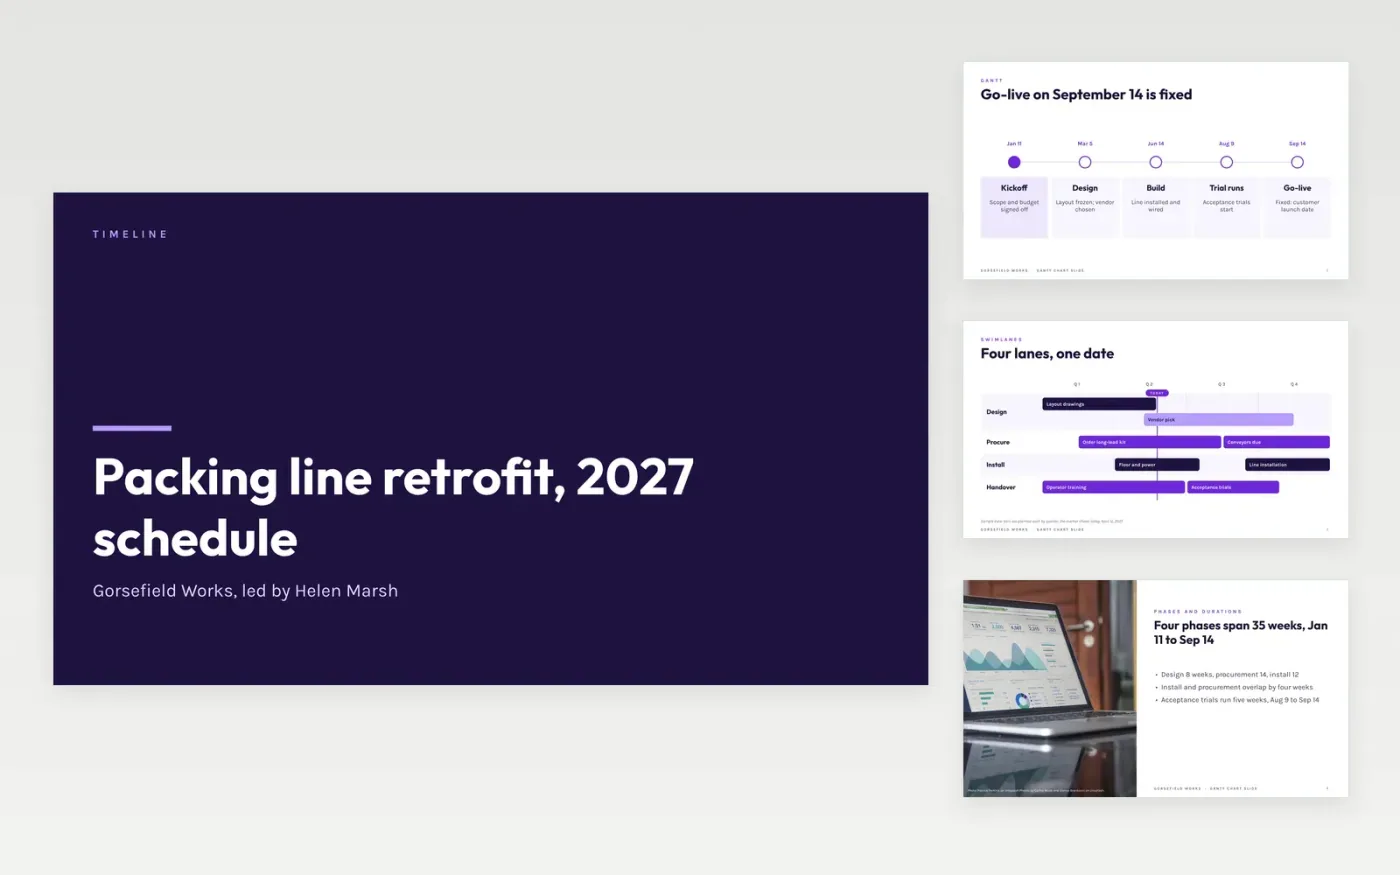
A schedule is only useful if people can see the dates, the order and what slips when something is late. This deck presents a project on a milestone line and a swimlane roadmap, explains how to read the bars, then names the critical path and the assumptions behind every date. It stays visual and light on text, so a sponsor can read the next milestone in seconds.
The sample is a fictional packing line retrofit at Gorsefield Works, running from January 11 to September 14, 2027 across four lanes. Four critical tasks fill 25 of the 35 weeks, and the go-live date is fixed. Replace the axis, the lane names, the dates and owners, and mark your own fixed dates and assumptions.
Click Make a copy in Google Slides, then confirm on the Google page. The copy is saved to your own Google Drive.
Set the start and end of the axis and rename the lanes and phases to match your project.
Replace the milestone dates and owners, and mark each fixed date in the fixed-date color.
Redraw the critical path using only tasks with zero float, then list the assumptions your dates depend on.
Delete the guide slide, then share the deck or present it.
Only tasks with zero float: if one slips by a day, the final date slips by a day. Marking everything critical hides the work that really drives the date.
Aim for eight to twelve bars. If you need more, keep this slide at phase level and move task detail to an appendix that only the delivery team tracks.
No. The organization, people and figures are fictional sample data. Replace every name, email address, date and number with your own before presenting.
More Google Slides templatesMore project management templates
Slides + PowerPoint11 slides
Free
Docs + Word5 pages
Free
Slides + PowerPoint11 slides
Free
Slides + PowerPoint12 slides
Free
Slides + PowerPoint11 slides
Free
Slides + PowerPoint12 slides
Free
Slides + PowerPoint10 slides
Free