Gantt Chart Slide
Slides + PowerPoint11 slides
Free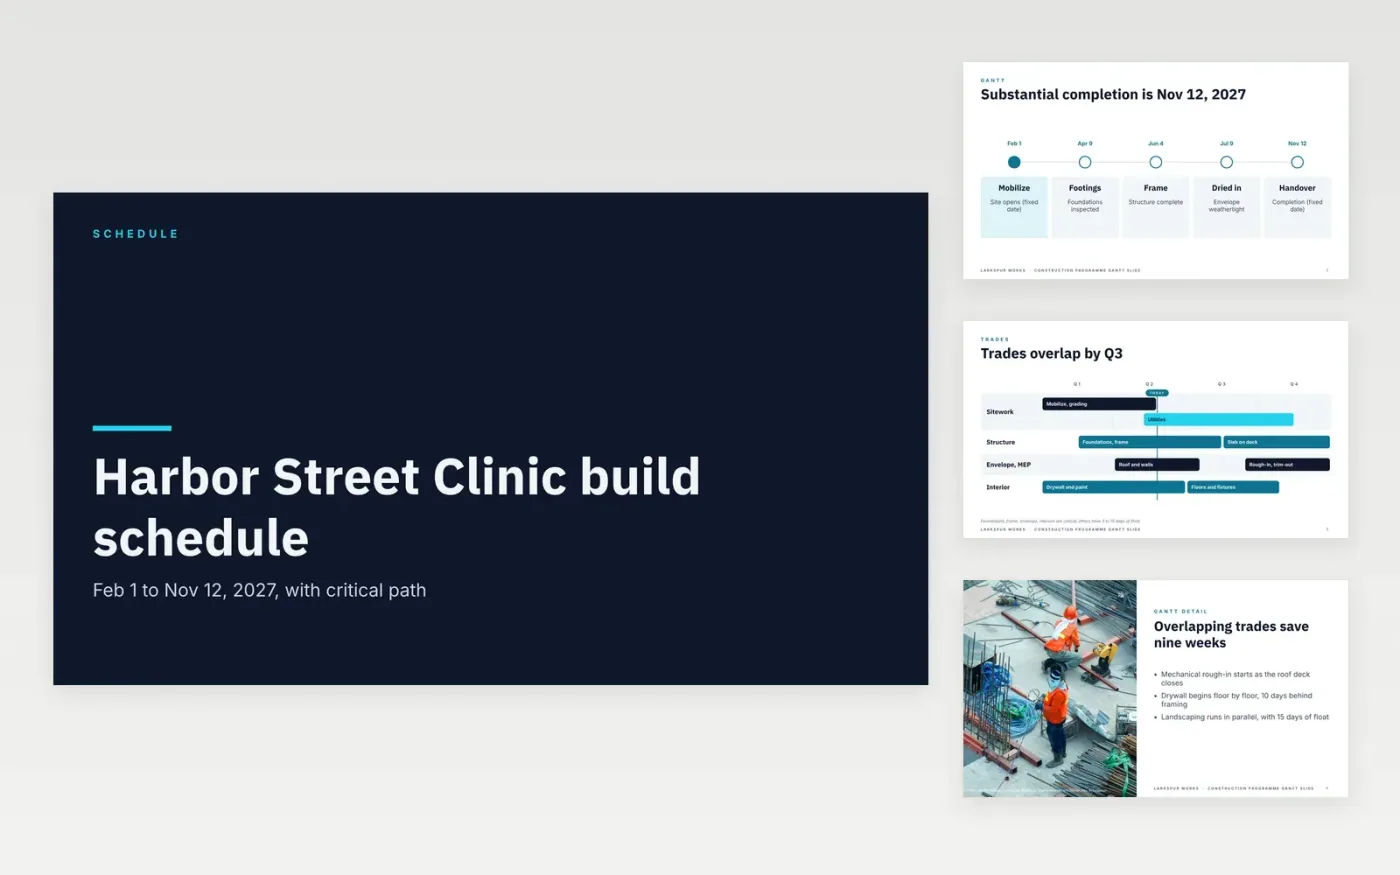
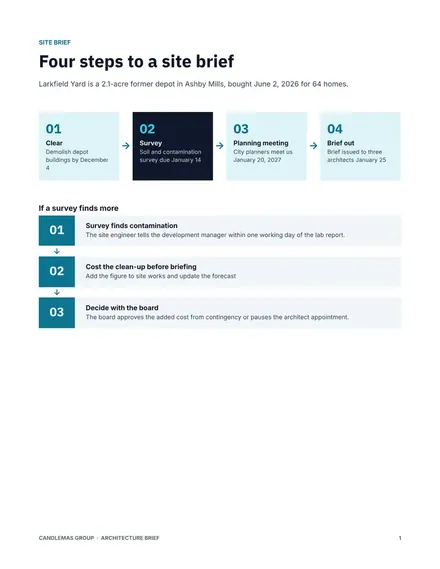
Clients and sponsors want the end date and the next milestone, not a 40-line chart. This deck shows the timeline, the trades by quarter, the critical path with its float, the risks that could move it and the dates the client can hold you to.
The sample follows Larkspur Works building the Harbor Street Clinic from February 1 to November 12, 2027, a 41-week job whose critical path runs 29 weeks, or 71% of the duration. Replace the project, dates, trades, float and owners with your own, and mark which dates are fixed.
Click Make a copy in Google Slides, then confirm on the Google page. The copy is saved to your own Google Drive.
Replace the project name, start and end dates and the five timeline milestones with your own, and say which dates are fixed.
Relabel the roadmap lanes with your trades, then edit the four critical path cards to list only tasks with zero float.
Update the risks, the assumptions note and the owners for each key date, and set a review date.
Delete the guide slide, then share the deck with your client or present it at the next progress meeting.
Yes. It is a free Google Slides template. Make a copy to your own Google Drive and edit the dates, trades and cards for your own project.
Only tasks with zero float: if one slips a day, the finish date slips a day. Keep the list to four to seven tasks and show float for everything else.
No. Larkspur Works, the Harbor Street Clinic, the people, dates and figures are fictional sample content. Replace them with your own before sharing.
More Google Slides templatesMore project management templates
Slides + PowerPoint11 slides
Free
Slides + PowerPoint10 slides
Free
Slides + PowerPoint12 slides
Free