Annual Report
Docs + Word6 pages
FeaturedFree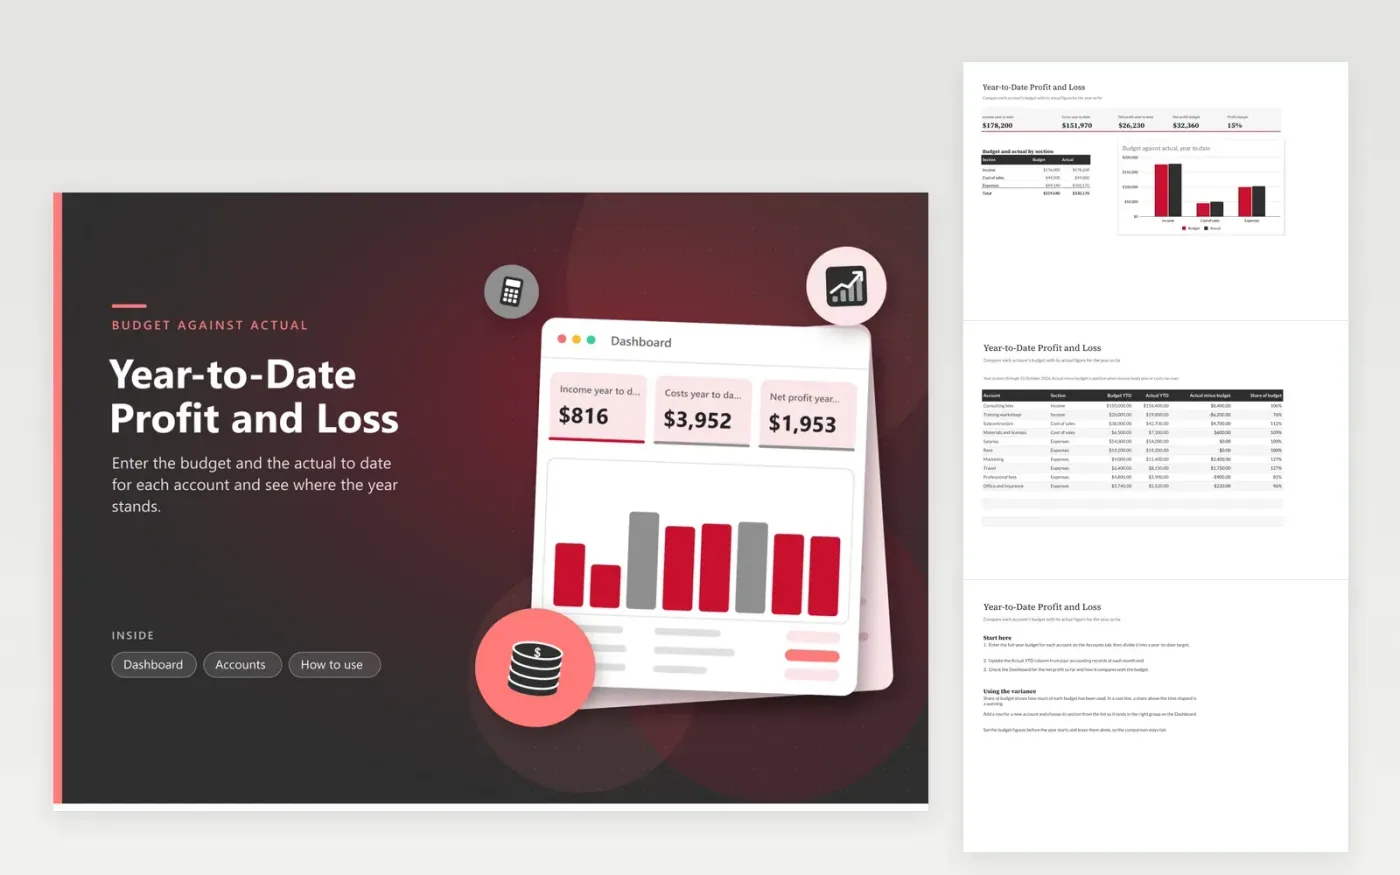
This template suits owners, managers and finance leads who review the year as it goes. The Accounts tab lists each account with its section (income, cost of sales or expenses), budget year to date, actual year to date, the variance and the share of budget used. Sample figures run through 31 October 2026 for a consulting firm with income, subcontractor costs and overheads.
The Dashboard shows year-to-date income, costs and net profit next to the net profit budget and profit margin. A column chart sets budget against actual for each section. Update the actual column from your ledger at each month end, and the totals and chart follow without any other changes.
Click Make a copy in Google Sheets, then confirm on the Google page. The copy is saved to your own Google Drive.
Start on the Accounts tab: replace the sample rows with your own.
Keep the formula columns as they are; they fill in as you type.
Read the How to use tab for tips. For Excel, download the .xlsx file instead.
Not always. Some income and costs fall in busy seasons, so a flat monthly split can make the year look worse or better than it is. Enter the year-to-date budget for each account using your seasonal plan, so the comparison measures performance rather than timing.
The variance is actual minus budget, so a cost that is higher than planned shows as a positive number. For income, a positive variance means you are ahead of plan. Read each row with its section in mind.
Yes. Type the account name at the bottom of the Accounts table and pick its section. Enter a budget for the period that remains, or leave it at zero if the cost was not planned, so the figures explain themselves.
Docs + Word6 pages
FeaturedFree
Excel
FeaturedFree
Sheets + Excel5 tabs
Free
Sheets + Excel5 tabs
Free
Sheets + Excel4 tabs
Free
Sheets + Excel5 tabs
Free
Sheets + Excel4 tabs
Free
Sheets + Excel4 tabs
Free
Sheets + Excel5 tabs
Free
Sheets + Excel4 tabs
Free
Sheets + Excel4 tabs
Free
Sheets + Excel4 tabs
Free
Sheets + Excel5 tabs
Free
Sheets + Excel4 tabs
Free