Annual Report
Docs + Word6 pages
FeaturedFree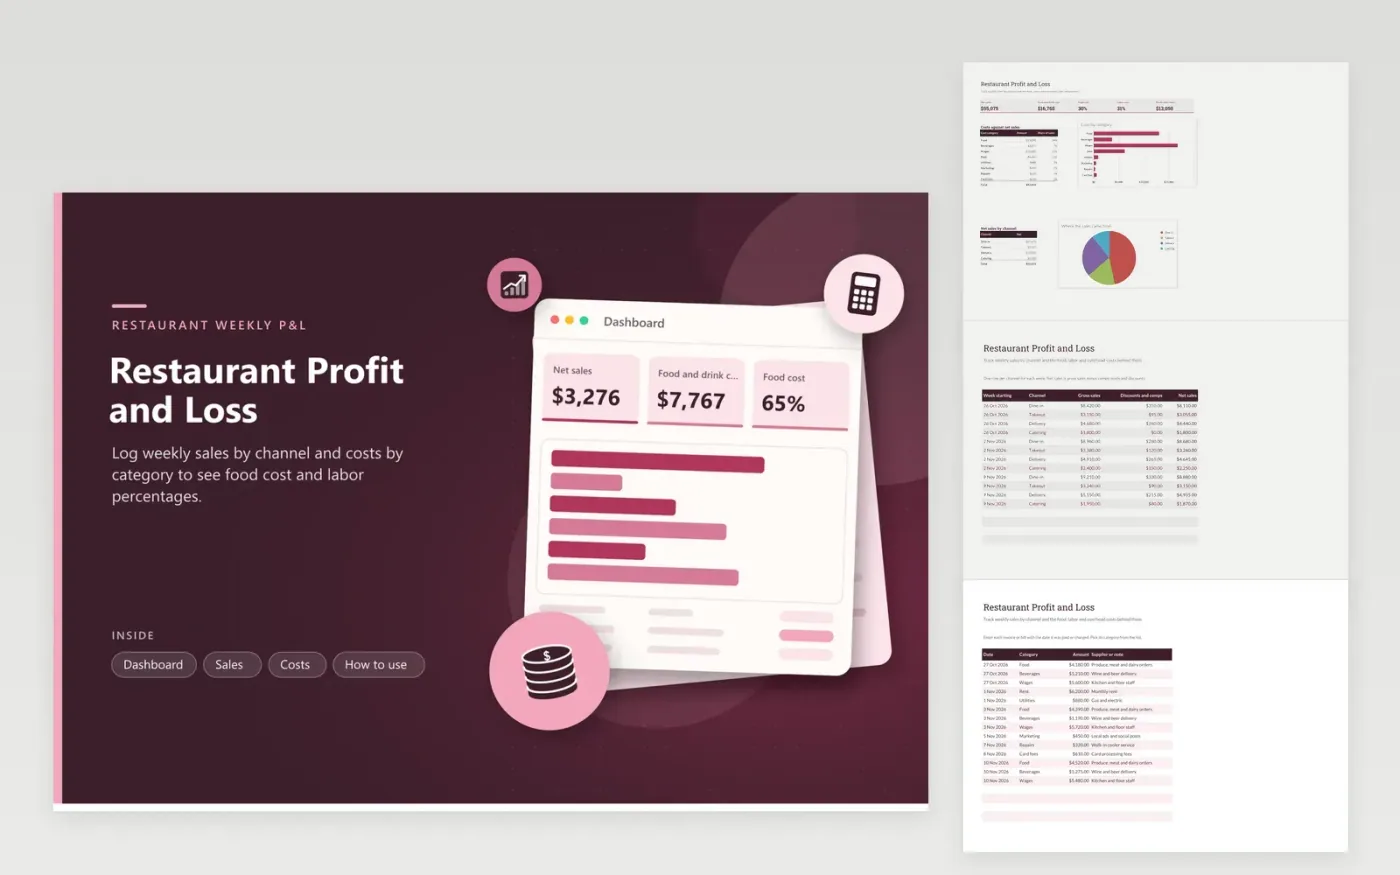
This template is built for restaurant owners and managers who check the numbers every week. The Sales tab records gross sales, discounts and comps for dine-in, takeout, delivery and catering, and calculates net sales. Every bill goes on the Costs tab under a category, including food, beverages, wages, rent, utilities, marketing, repairs and card fees.
The Dashboard shows net sales, food and drink cost, food cost and labor cost as percentages of sales, and profit after costs. Two breakdowns sit beside charts: costs as a share of sales by category, and net sales by channel. The sample weeks run from late October to early November 2026, with made-up figures for a neighborhood restaurant.
Click Make a copy in Google Sheets, then confirm on the Google page. The copy is saved to your own Google Drive.
Start on the Sales tab: replace the sample rows with your own.
Keep the formula columns as they are; they fill in as you type.
Read the How to use tab for tips. For Excel, download the .xlsx file instead.
Many full-service restaurants aim for food cost between about 28 and 35 percent of sales, but the right target depends on your menu, portions and prices. Set your own target from your recipe costs, then use the Dashboard to see whether each week is on track.
Record them gross, then log the commission as a card fees or marketing cost. That way you can see what each channel really earns. Mixing net and gross figures makes the channel comparison misleading.
Only costs entered on the Costs tab are included. Add every expense you pay, including insurance, licenses and loan interest, or the figure will look higher than it is.
Docs + Word6 pages
FeaturedFree
Excel
FeaturedFree
Sheets + Excel5 tabs
Free
Sheets + Excel5 tabs
Free
Sheets + Excel4 tabs
Free
Sheets + Excel5 tabs
Free
Sheets + Excel4 tabs
Free
Sheets + Excel4 tabs
Free
Sheets + Excel4 tabs
Free
Sheets + Excel4 tabs
Free
Sheets + Excel4 tabs
Free
Sheets + Excel4 tabs
Free
Sheets + Excel5 tabs
Free
Sheets + Excel4 tabs
Free