Annual Report
Docs + Word6 pages
FeaturedFree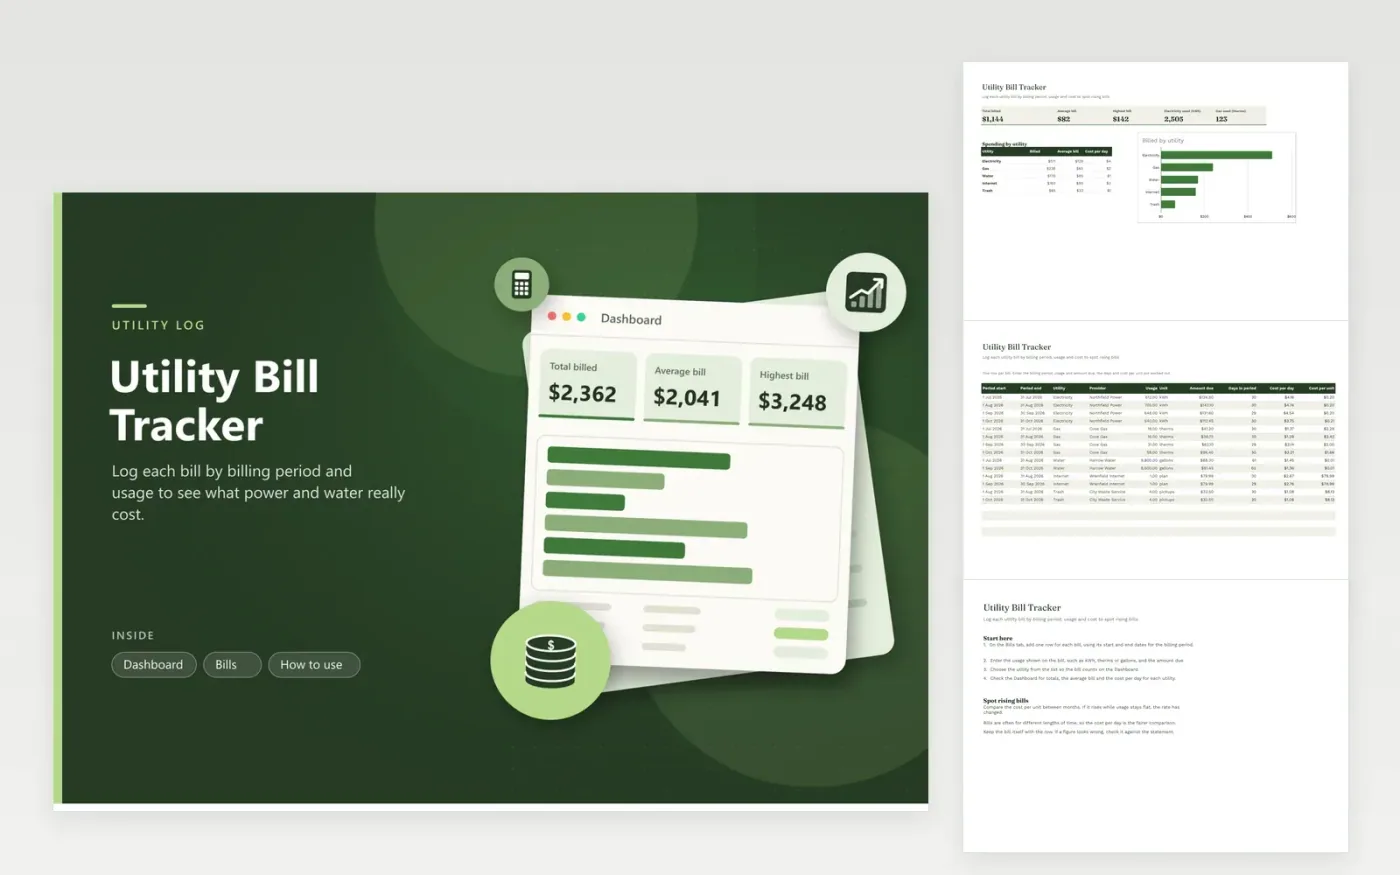
The Utility Bill Tracker suits a household or small office that wants to see what power, heating, water, internet and trash collection cost over time. The Bills tab records each bill's start and end dates, provider, usage and unit, and the amount due, then works out the days in the period, the cost per day and the cost per unit. The Dashboard shows the total billed, average and highest bill, kilowatt-hours and therms used, and a breakdown by utility.
The sample covers July to October 2026 with fourteen bills across five utilities. Swap in your real providers and amounts, and enter each bill as soon as it arrives. Compare the cost per unit from month to month: a rising rate with steady usage points to a price change, while rising usage points to a change in how the home is used.
Click Make a copy in Google Sheets, then confirm on the Google page. The copy is saved to your own Google Drive.
Start on the Bills tab: replace the sample rows with your own.
Keep the formula columns as they are; they fill in as you type.
Read the How to use tab for tips. For Excel, download the .xlsx file instead.
Most bills print the start and end dates of the service period near the amount due. Use those dates rather than the date the bill arrived. If the period is unclear, check the statement or ask the provider.
Cost per day divides the amount due by the days the bill covers, so bills of different lengths can be compared. It is an average, and it includes fixed charges that do not change with usage.
Duplicate the workbook for every property so bills and totals stay separate. Keep the utility names the same in each copy, so the Dashboard breakdowns line up when you compare them.
Docs + Word6 pages
FeaturedFree
Excel
FeaturedFree
Sheets + Excel9 tabs
Free
Sheets + Excel5 tabs
Free
Sheets + Excel5 tabs
Free
Sheets + Excel5 tabs
Free
Sheets + Excel4 tabs
Free
Sheets + Excel4 tabs
Free
Sheets + Excel4 tabs
Free
Sheets + Excel3 tabs
Free