Project Proposal
Docs + Word5 pages
FeaturedFree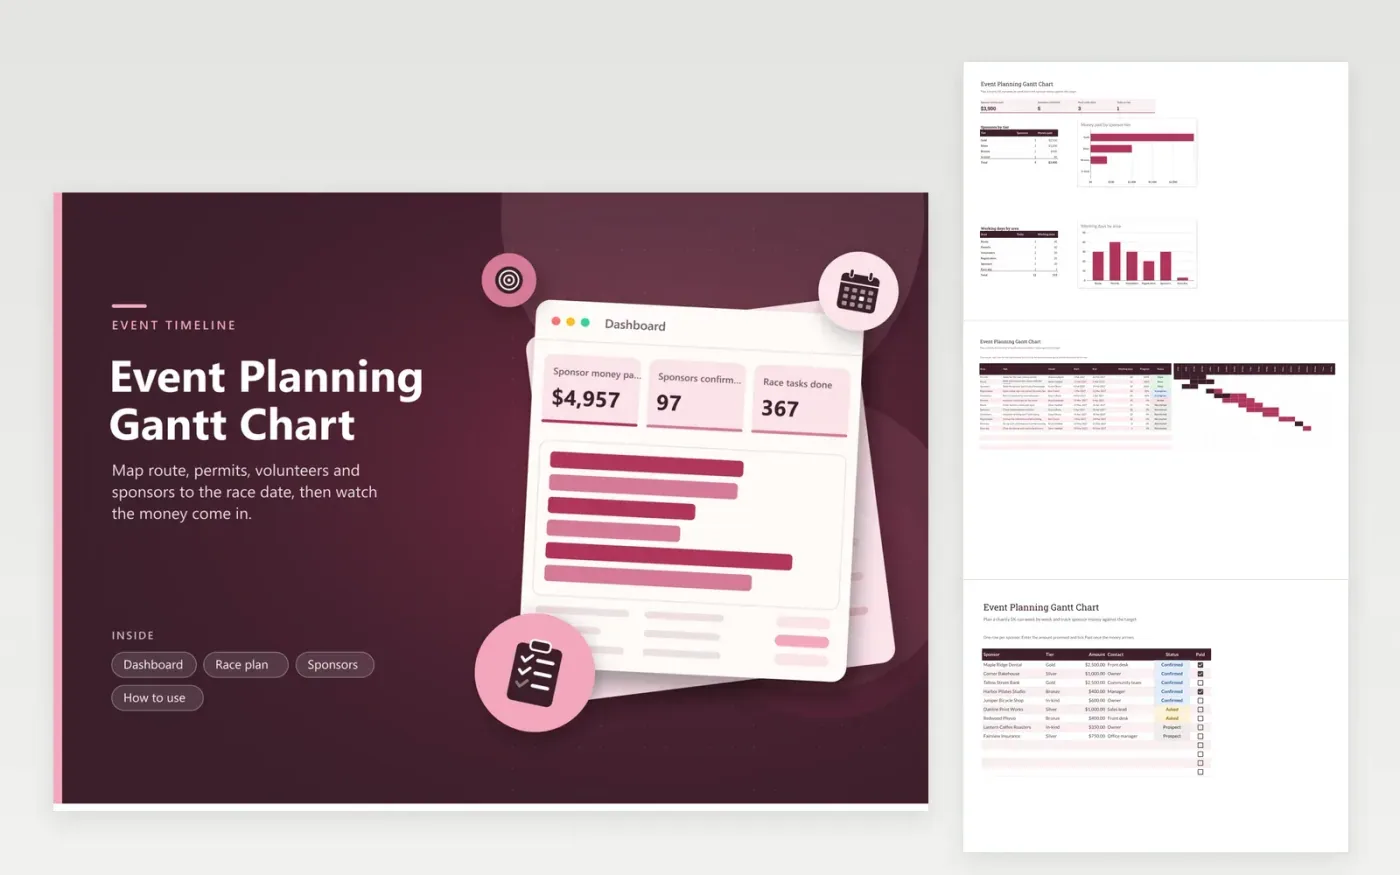
This Gantt chart is for volunteer committees and small nonprofits running a community race or fun run. The Race plan tab lists each task by area, such as permits, route, volunteers or race day, plus an owner, schedule dates, workdays, completion percentage, state and a 20-week timeline. The Sponsors tab records each sponsor's tier, amount, contact and whether the money has been paid. The Dashboard shows the money paid, sponsors confirmed, tasks done and tasks at risk, with charts by tier and area.
The demo plan covers a 5K run in May 2027. Swap in your own race details, add your sponsors and tick Paid as the checks arrive. Check the at-risk count each week, since a late permit or insurance certificate is the usual reason a race date slips.
Click Make a copy in Google Sheets, then confirm on the Google page. The copy is saved to your own Google Drive.
Start on the Race plan tab: replace the sample rows with your own.
Keep the formula columns as they are; they fill in as you type.
Read the How to use tab for tips. For Excel, download the .xlsx file instead.
Set the tier to In-kind and enter the value you agreed in the Amount column. Leave Paid unticked, since no cash arrived, and tick it only once the goods or services are received.
Yes. Change the areas and tasks on the Race plan tab to match your event, such as a gala, fair or fundraiser. Keep the dates and owners, since the timeline and dashboard use them.
Give them to one named person with a clear due date. Permit rules and insurance requirements vary by city, so check them with the local council and your insurer early.
More Google Sheets templatesMore project management templates
Docs + Word5 pages
FeaturedFree
Docs + Word1 page
Free
Docs + Word11 pages
Free
Sheets + Excel4 tabs
Free
Sheets + Excel4 tabs
Free
Sheets + Excel4 tabs
Free
Sheets + Excel4 tabs
Free
Sheets + Excel3 tabs
Free
Sheets + Excel4 tabs
Free