Project Proposal
Docs + Word5 pages
Free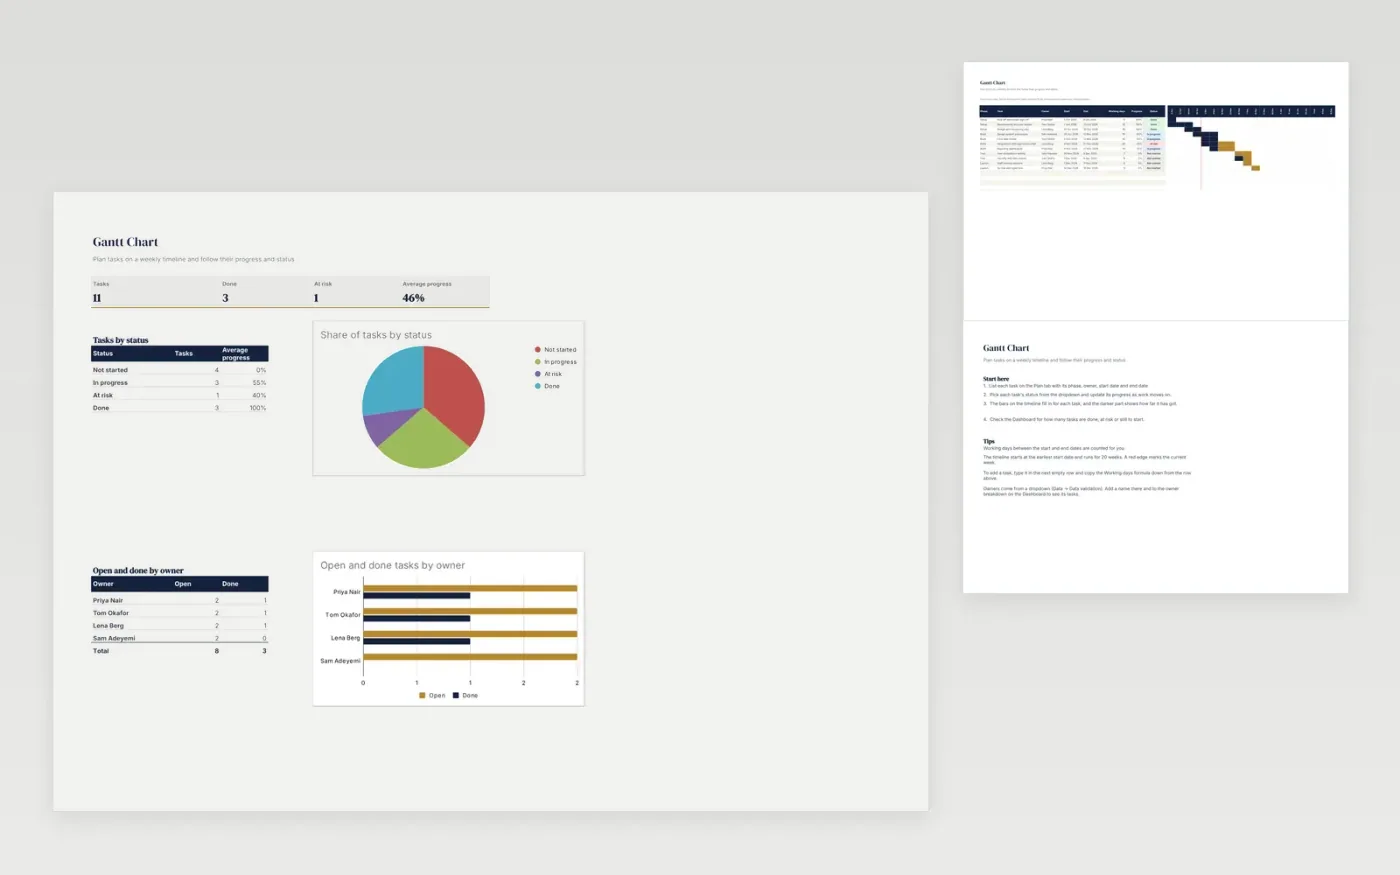
This Gantt chart template plans a project as a list of tasks, each with a phase, owner, dates, progress and status. The Plan tab draws a weekly timeline from the start dates, so you can see what runs when and where the work overlaps. The Dashboard counts tasks by status and by owner, with charts that update as the plan changes.
It comes with sample data for a software project. Make a copy, replace the sample rows with your own tasks, and the timeline, working-day counts and dashboard update on their own.
Click Make a copy in Google Sheets, then confirm on the Google page. The copy is saved to your own Google Drive.
Start on the Plan tab: replace the sample rows with your own.
Keep the formula columns as they are; they fill in as you type.
Read the How to use tab for tips. For Excel, download the .xlsx file instead.
Yes. The Gantt Chart template is free to download and use. Make a copy in Google Sheets or download the Excel file.
Yes. Download the .xlsx file and open it in Excel, Google Sheets or another compatible spreadsheet app. The timeline and dashboard work in both.
The timeline starts from the earliest start date on the Plan tab and runs for 20 weeks. Each bar fills the weeks between its start and end dates, and the darker part shows progress.
More Google Sheets templatesMore project management templates
Docs + Word5 pages
Free
Slides + PowerPoint11 slides
Free
Docs + Word6 pages
Free
Sheets + Excel4 slides
Free
Sheets + Excel4 slides
Free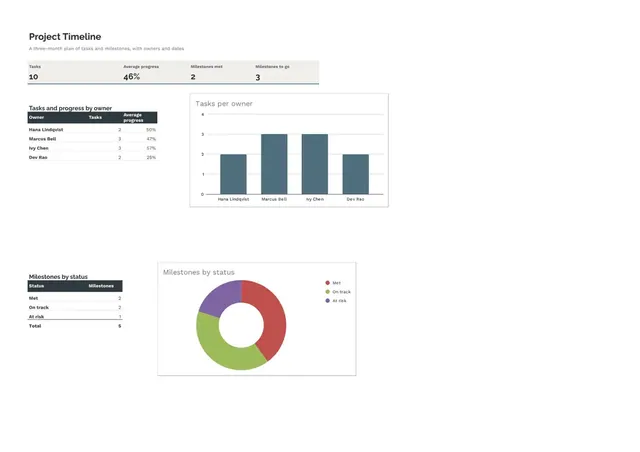
Sheets + Excel4 slides
Free