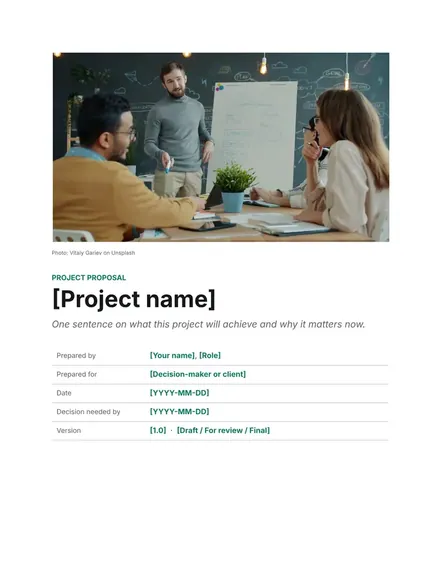
Project Proposal
Docs + Word5 pages
FeaturedFree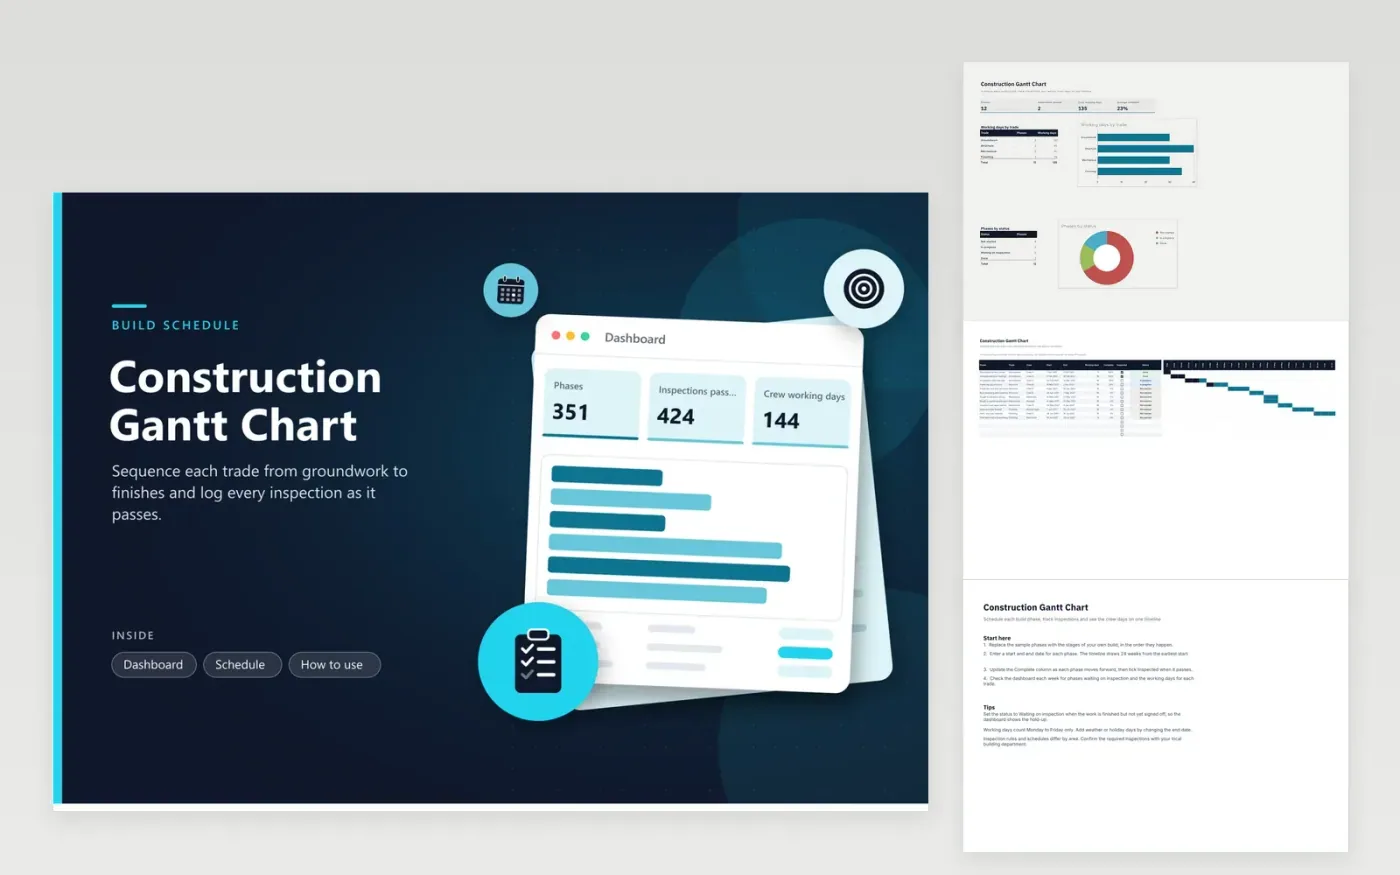
This Gantt chart is for builders, renovators and owners who manage a build phase by phase. The Schedule tab gives every phase a trade, a crew, a first and last day, working days, percent complete, an Inspected tick box and a status, and draws a 24-week timeline with progress shading. The Dashboard totals the phases, inspections passed and crew working days, with charts of working days by trade and phases by status.
The sample schedule covers a small house addition, from site clearance through roofing, rough-in and drywall to final fixtures. Swap in your own phases, then update the Complete column and tick Inspected as each sign-off comes through. Phases waiting on an inspector show up on the dashboard, so the hold-ups are easy to spot.
Click Make a copy in Google Sheets, then confirm on the Google page. The copy is saved to your own Google Drive.
Start on the Schedule tab: replace the sample rows with your own.
Keep the formula columns as they are; they fill in as you type.
Read the How to use tab for tips. For Excel, download the .xlsx file instead.
Tick the Inspected box on that phase's row. The Inspections passed figure on the dashboard counts each ticked row, so keep the tick for phases that have a signed-off inspection.
The bars run across the calendar weeks between each phase's first and last day. Working days in the table count Monday to Friday only, which is the figure to use for crew planning.
Yes, the layout works for larger jobs too. Add more rows for each phase and split very large projects into one tab per building or floor.
More Google Sheets templatesMore project management templates
Docs + Word5 pages
FeaturedFree
Docs + Word1 page
Free
Docs + Word11 pages
Free
Sheets + Excel5 tabs
Free
Sheets + Excel4 tabs
Free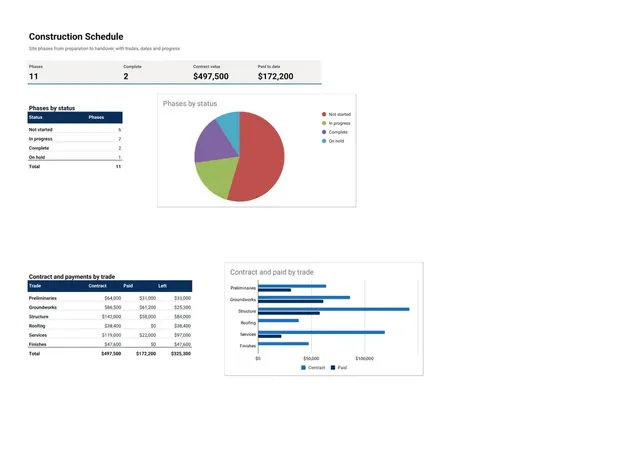
Sheets + Excel4 tabs
Free
Sheets + Excel4 tabs
Free
Sheets + Excel3 tabs
Free
Sheets + Excel4 tabs
Free