Annual Report
Docs + Word6 pages
FeaturedFree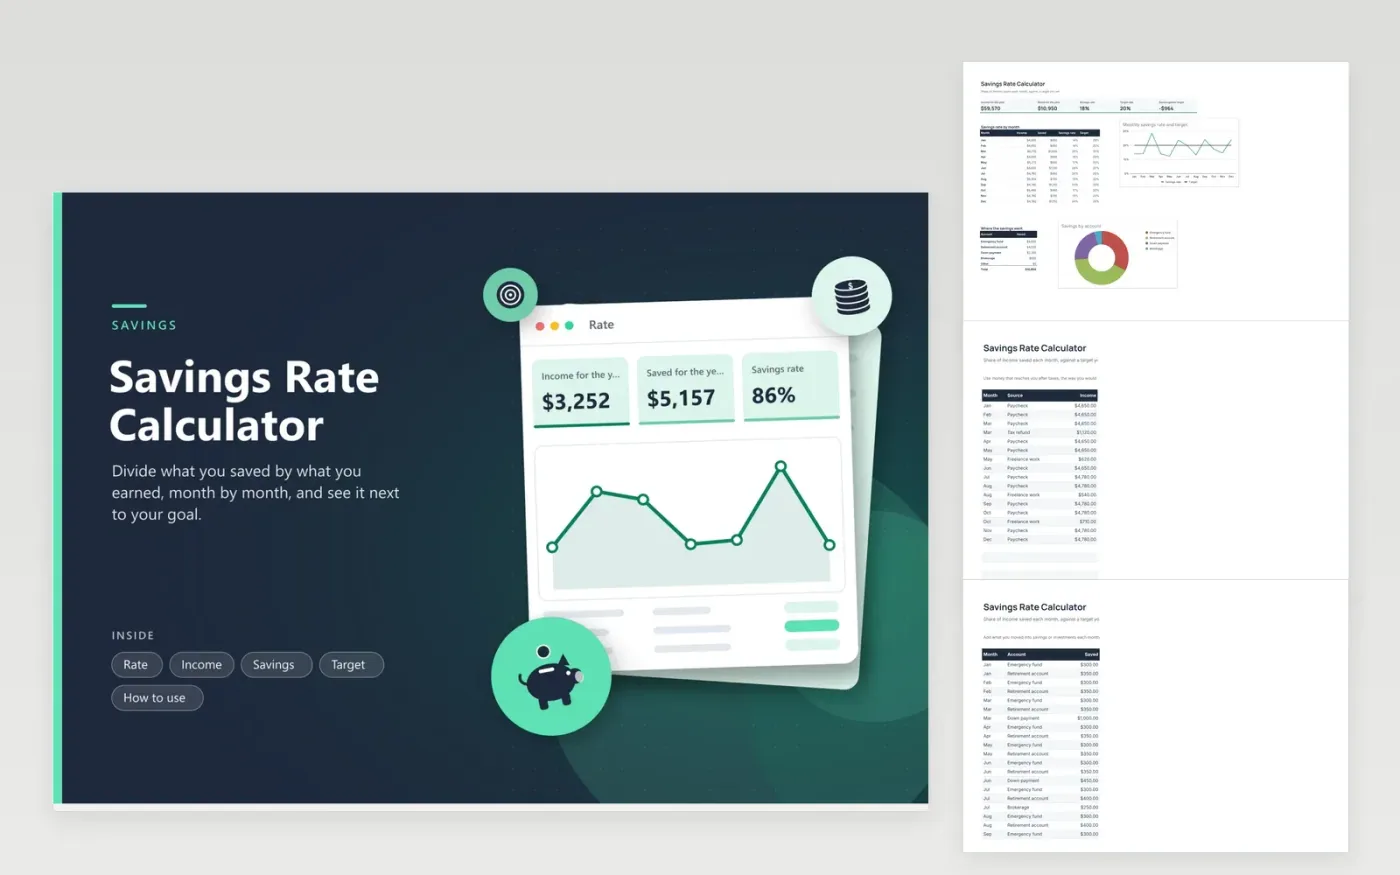
Your savings rate is the share of income you keep rather than spend, and it is easier to improve once you can see it month by month. Add your after-tax income on one tab and your deposits on another. The Rate tab divides the two for each month, adds up the year and draws the result as a line next to a target you choose.
A tax refund or a freelance month can swing the rate, so the sheet keeps every source and every deposit as its own row. A second chart shows which accounts received the money, such as an emergency fund or a down payment. The Target tab holds a single percent that is entirely yours, with no recommended number built in, and the Saved against target figure shows the dollars above or below it.
Click Make a copy in Google Sheets, then confirm on the Google page. The copy is saved to your own Google Drive.
Start on the Income tab: replace the sample rows with your own.
Keep the formula columns as they are; they fill in as you type.
Read the How to use tab for tips. For Excel, download the .xlsx file instead.
Take the money saved during a period and divide it by the income earned during that same period. The Rate tab does this for each month and for the full year.
Both are used, so pick one and stay with it. The sample uses income after taxes; choose one definition and keep it for every month so the rates can be compared.
It depends on your goals, your age and your expenses, so the sheet leaves the target to you. Set your own percent on the Target tab and read the gap.
Docs + Word6 pages
FeaturedFree
Excel
FeaturedFree
Sheets + Excel5 tabs
Free
Sheets + Excel5 tabs
Free
Sheets + Excel5 tabs
Free
Sheets + Excel5 tabs
Free
Sheets + Excel4 tabs
Free
Sheets + Excel5 tabs
Free
Sheets + Excel5 tabs
Free
Sheets + Excel23 tabs
Free
Sheets + Excel8 tabs
Free
Sheets + Excel6 tabs
Free
Sheets + Excel6 tabs
Free
Sheets + Excel9 tabs
Free
Sheets + Excel6 tabs
Free