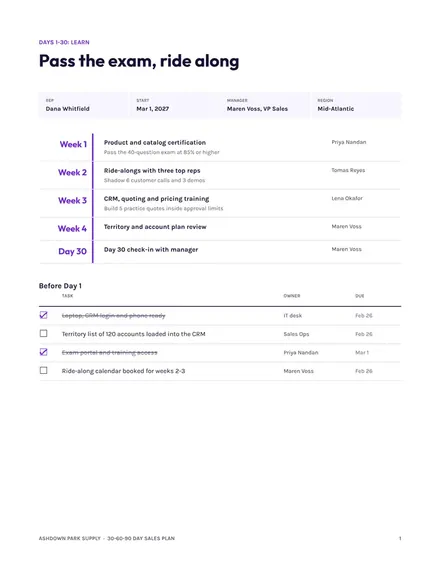
30-60-90 Day Sales Plan
Docs + Word6 pages
Free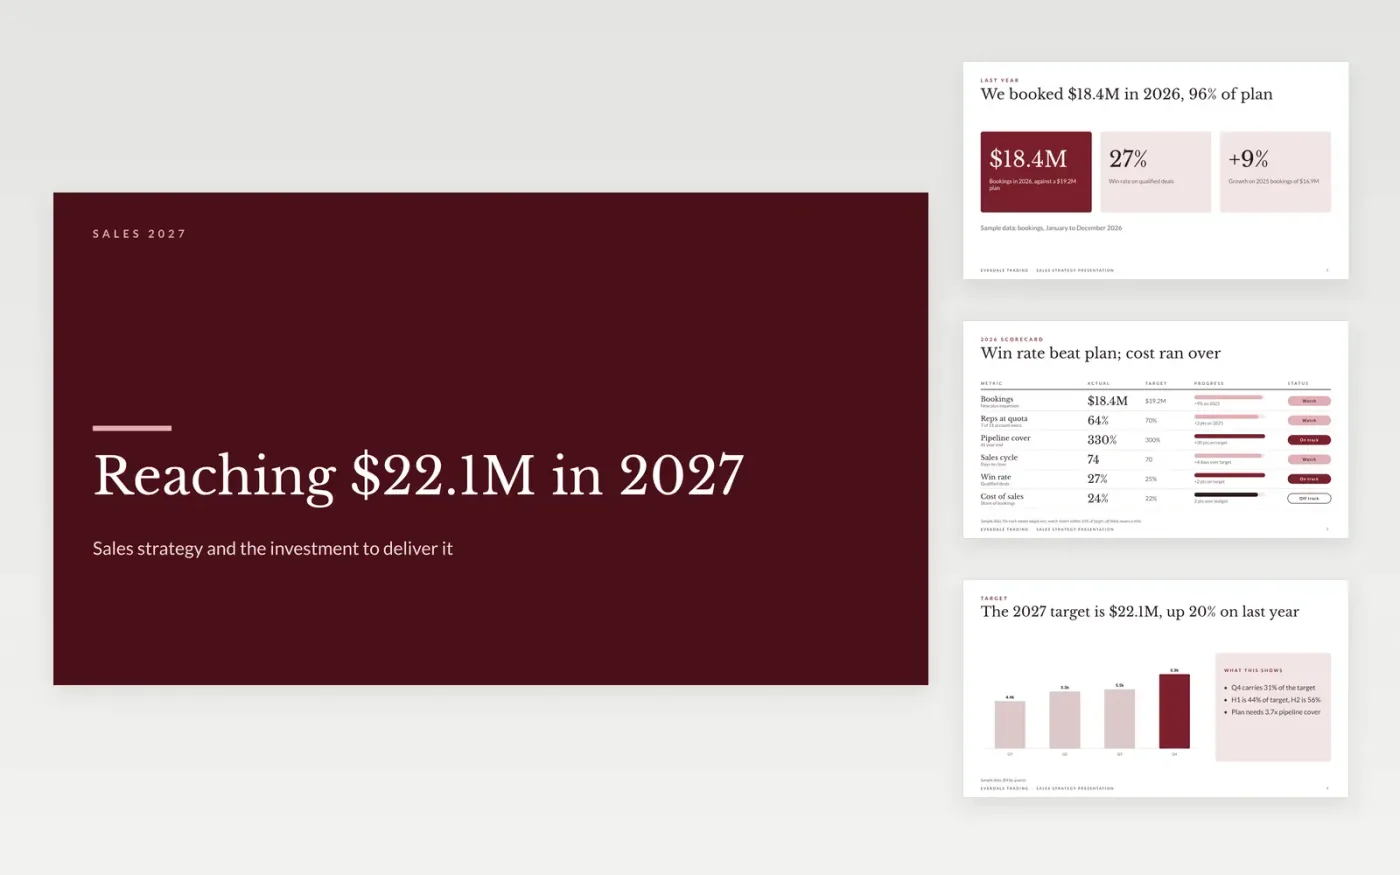
A board does not approve a number; it approves a plan that explains how the number is reached. This deck shows last year's results first, then builds the target from pipeline, win rate and deal size, splits it by segment, sets out the plays, compares three investment options and lists the risks with a response each.
The sample follows Everdale Trading, which booked $18.4M last year and asks the board to back a $22.1M target. It shows a scorecard, a quarterly target chart, four segments, a recommended $845,000 investment and five risks. Replace the bookings, segments, headcount and budget lines with your own, and check that the sums match.
Click Make a copy in Google Slides, then confirm on the Google page. The copy is saved to your own Google Drive.
Enter last year's bookings by segment, then set this year's target from your growth assumption.
Rebuild the revenue build from your pipeline cover, win rate, deal size and cycle length, and replace the segment names with those in your CRM.
Set your rep headcount, ramp time and budget lines, and check that the investment options add up to the plan.
Delete the guide slide, then share or present the deck to your board.
Start from last year's actual bookings and your growth assumption, then prove it with a revenue build: pipeline needed equals target divided by win rate, and deals needed equals target divided by average deal size.
It shows the board what each level of spend buys, including the cost of doing nothing. A recommended option with a clear gap to target is easier to approve than one number.
No. The organization, the people and every figure in the sample are fictional. They are there to show what a finished sales strategy presentation looks like.
Docs + Word6 pages
Free
Docs + Word9 pages
Free
Slides + PowerPoint14 slides
Free
Slides + PowerPoint12 slides
Free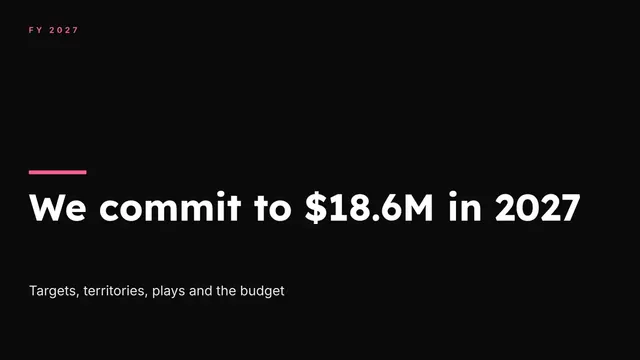
Slides + PowerPoint10 slides
Free
Google Sheets
Free