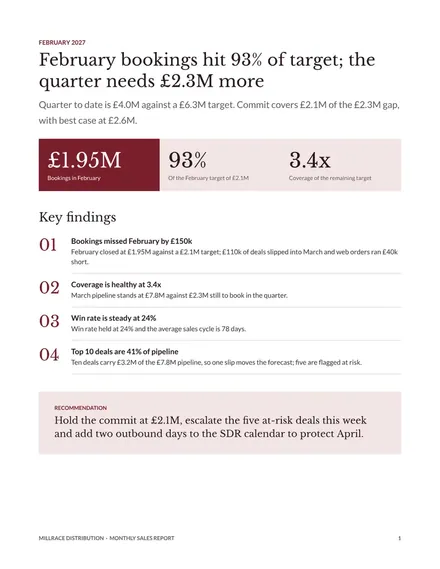
Monthly Sales Report
Docs + Word8 pages
Free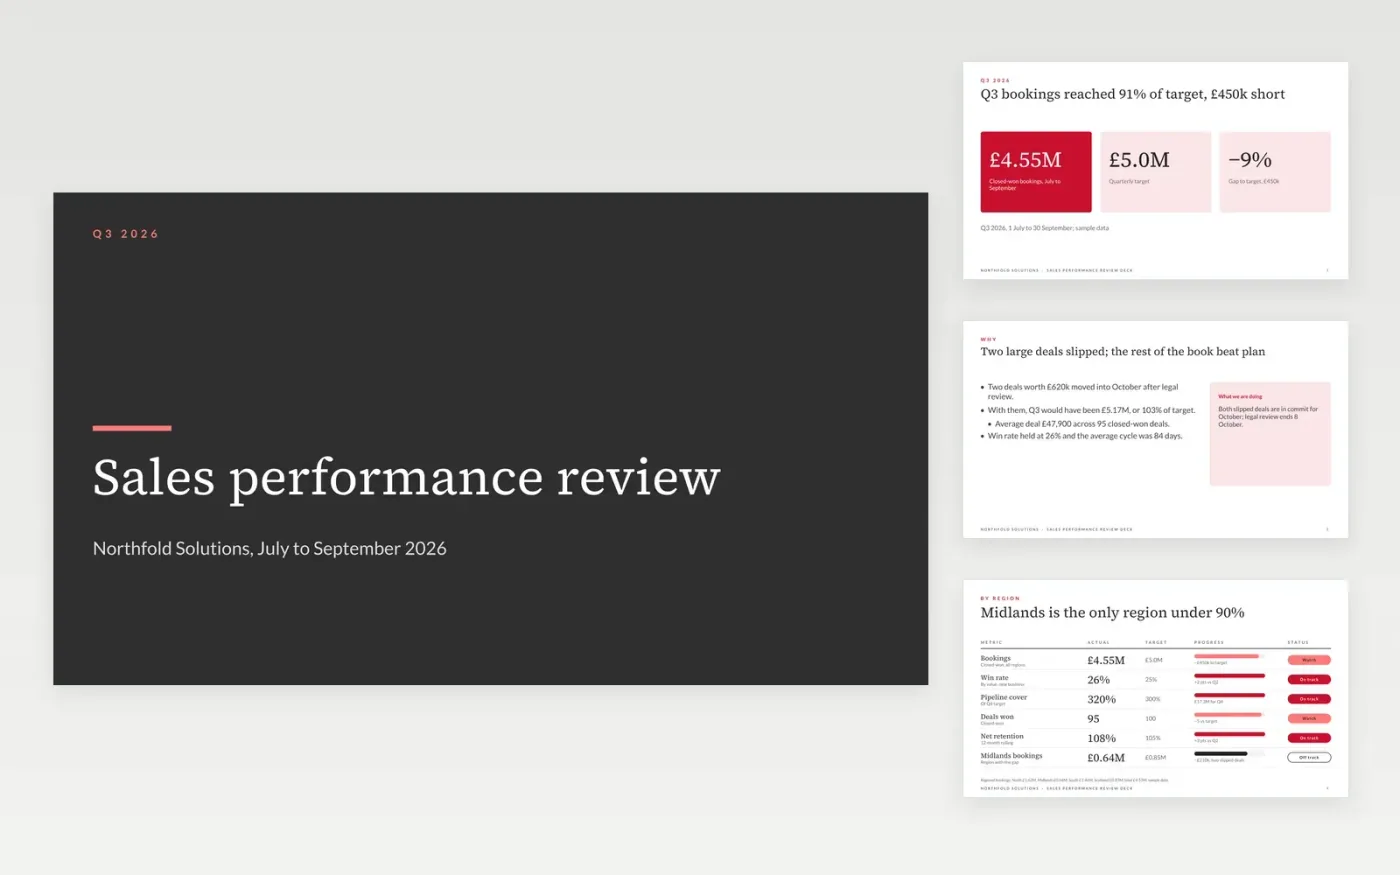
Sales leaders need to know in two minutes whether the team will hit the number, where the pipeline is thin and what is being done about it. This deck starts with bookings against target, explains the gap, scores each measure, and splits results by region, product and rep before the funnel and the plan for next quarter.
The sample is the Q3 2026 review of Northfold Solutions, a fictional company: £4.55M booked against a £5.0M target, a 26% win rate and Q4 pipeline covering target 3.2 times. All figures agree from slide to slide. Replace the target and bookings with your CRM export, recompute coverage with your own stage probabilities, and write your own actions.
Click Make a copy in Google Slides, then confirm on the Google page. The copy is saved to your own Google Drive.
Set the reporting period and replace the target, bookings and regional figures with your CRM export.
Recompute pipeline cover and the funnel rates with your own stage probabilities, and check the parts add to the totals.
Write two sentences of commentary: what changed since the last report and what you will do next.
Delete the guide slide, then share or present the deck.
No. Northfold Solutions, its people and every figure are fictional sample data. Replace them with your own CRM numbers before you present.
Yes. Change the period on the cover and in the captions, and use weekly or monthly targets in the scorecard. The structure of gap, cause and action stays the same.
Replace the regional chart with teams, segments or branches, or delete the slide. The scorecard and funnel work for any team that reports against a target.
Docs + Word8 pages
Free
Slides + PowerPoint14 slides
Free
n8n
Free
Docs + Word8 pages
Free
Slides + PowerPoint10 slides
Free
Docs + Word6 pages
Free