Monthly Sales Report
Docs + Word8 pages
Free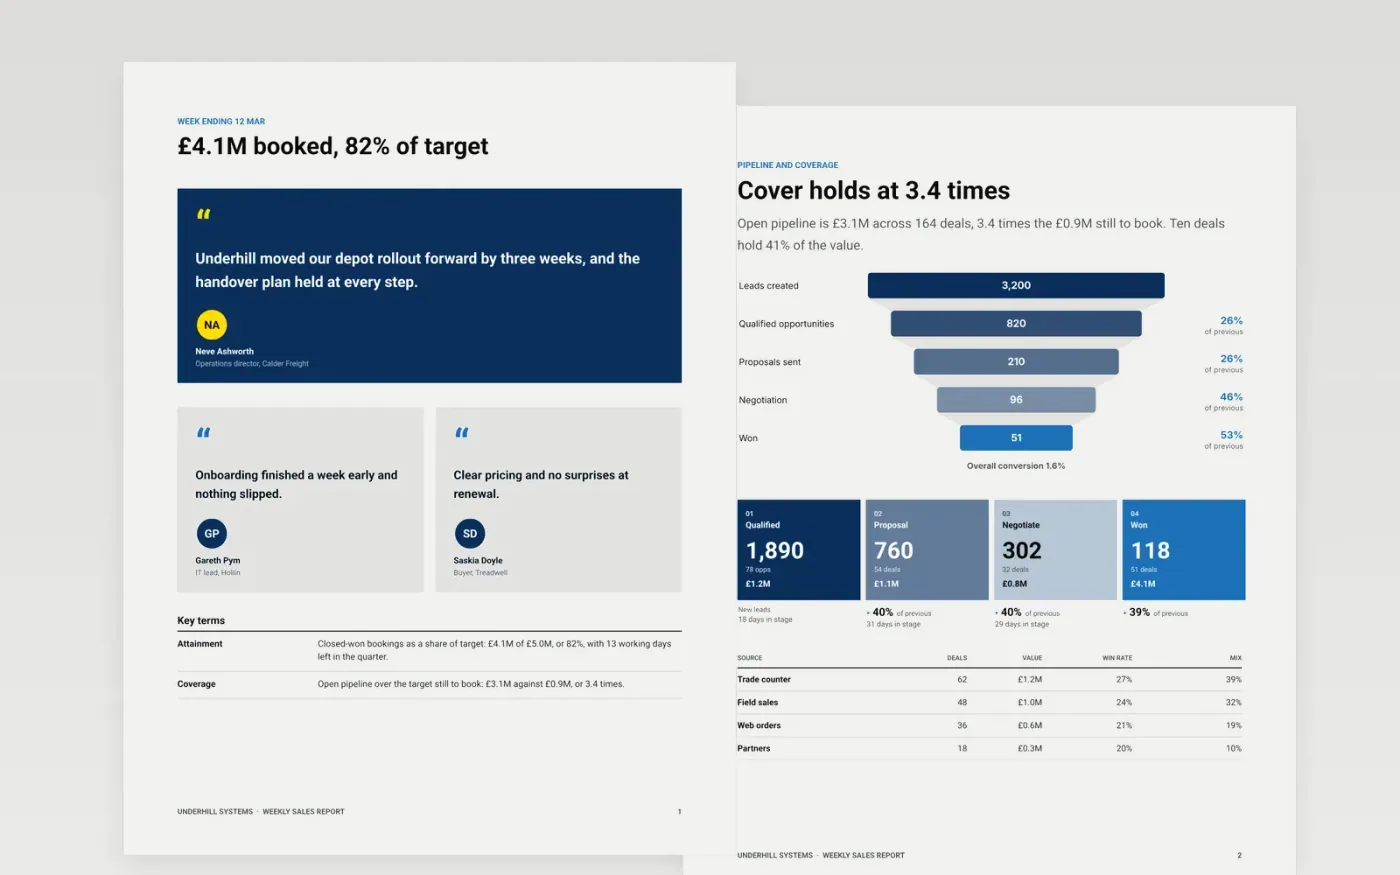
Sales leaders read a weekly report before a forecast call, and most of them get a table of bookings with no forecast, no coverage and no view of risk. This template puts the gap to target first, then the pipeline by stage and source, the activity behind it and a dated plan for the coming week, over six designed pages.
The sample follows Underhill Systems in the last three weeks of its first quarter: £4.1M booked against a £5.0M target, 3.4 times cover and a commit that lands at 94%. Replace the target and bookings with your CRM export, recompute cover with your own stage probabilities, then choose the deals that matter and rewrite the commentary.
Click Make a copy in Google Docs, then confirm on the Google page. The copy is saved to your own Google Drive.
Set the reporting period, then replace the target and booked figures on the first two pages with your CRM export.
Recompute pipeline cover, commit and best case from your own stage probabilities, and check that the source table still totals.
Choose the deals that matter, give each a one-line risk, an owner and a date, then rewrite the commentary in your own words.
Delete the guide page, then share the document or present it on your forecast call.
Yes. The logic is the same: attainment, cover, forecast, activity and a plan. Change the period, widen the dates and keep the arithmetic consistent across pages.
Report closed-won first, then add commit and best case as separate lines, as the sample does. Never fold them into one total, or the forecast call will argue about the number.
No. Underhill Systems, every person and every figure are fictional sample data made up for the example. Replace them with your own before you share the report.
Docs + Word8 pages
Free
Docs + Word8 pages
Free
n8n
Free
Slides + PowerPoint10 slides
Free
Slides + PowerPoint11 slides
Free