Google Cloud Three-Tier Web Architecture
Slides + PowerPoint5 slides
Free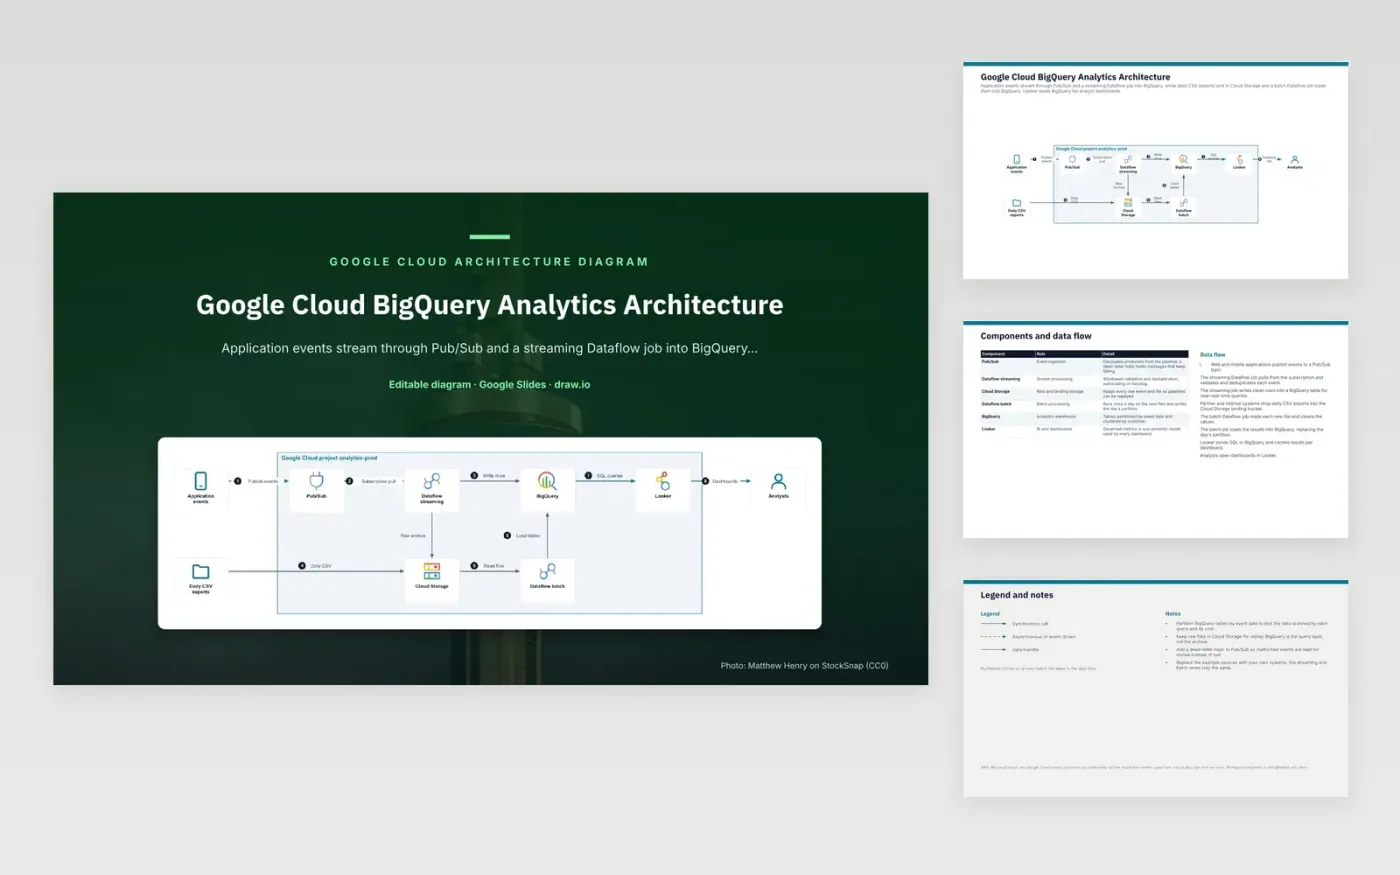
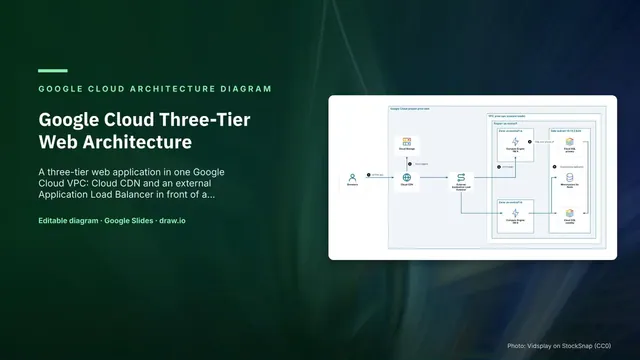
Web and mobile apps publish events to a Pub/Sub topic. A streaming Dataflow job pulls from the subscription, validates and deduplicates each event, and writes clean rows to BigQuery while keeping raw events in Cloud Storage. Partner and internal systems drop daily CSV exports into a Cloud Storage bucket. A batch Dataflow job reads each new file, cleans the values and loads the results into BigQuery, replacing that day's partition. Looker sends SQL to BigQuery, and analysts open the dashboards.
The design point is two lanes that meet in one query layer. Streaming gives near-real-time results, and the daily batch covers files that never arrive as events. Cloud Storage keeps every raw file so pipelines can be replayed, and BigQuery is the query layer rather than the archive. Tables are partitioned by event date to limit what each query scans. To adapt it, replace the sources and keep both lanes.
The diagram uses the official Google Cloud architecture icons, each labelled with its service name. AWS, Microsoft Azure and Google Cloud names and icons are trademarks of their respective owners, used here only to describe their services. WorkspaceTemplates is not affiliated with them.
Click Make a copy in Google Slides, then confirm on the Google page. The copy is saved to your own Google Drive.
Rename Application events, Daily CSV exports, Pub/Sub and the other boxes inside Google Cloud project analytics-prod to your own components, and delete the ones your system does not have.
Rewrite the 8-step data flow and the 6-row components table so they match the arrows you keep.
For the draw.io version, download gcp-bigquery-analytics-architecture-diagram.drawio and open it at app.diagrams.net.
A partitioned table lets a query read only the partitions its filter selects. A query for one week therefore scans about a week of data rather than the whole table, which lowers cost and speeds up results.
After a message has failed delivery the maximum number of times, Pub/Sub forwards it to the dead-letter topic. Malformed events are kept there for review instead of being lost or retried forever.
Cloud Storage keeps the original events and files unchanged, so a pipeline can be rerun after a bug fix. BigQuery holds the cleaned, queryable copy and is not treated as the archive.
More Google Slides templatesMore developer workflows templates
Slides + PowerPoint5 slides
Free
Slides + PowerPoint5 slides
Free
Slides + PowerPoint5 slides
Free