C4 Model Diagram
Slides + PowerPoint5 slides
Free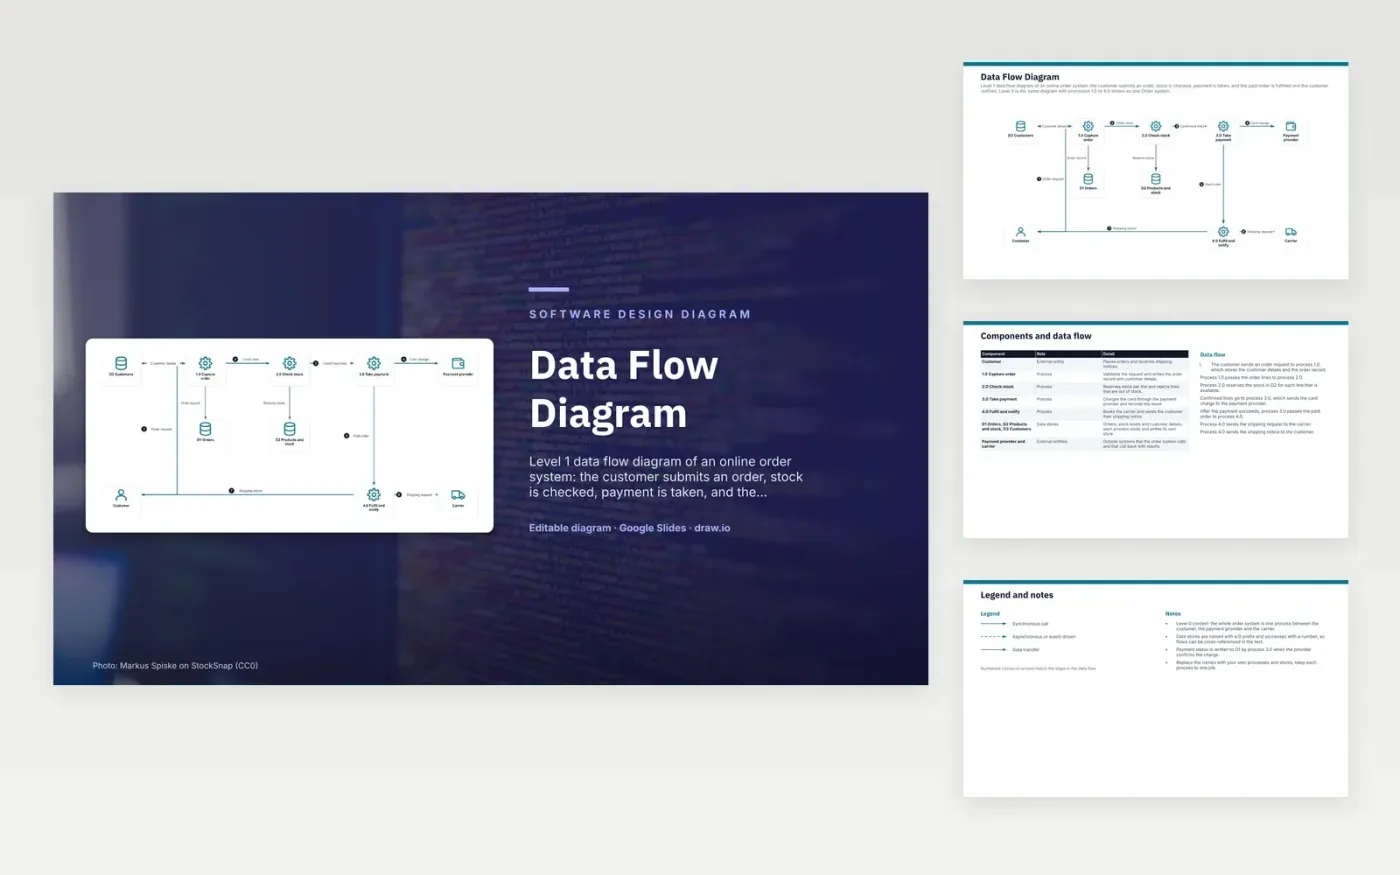
The customer sends an order request to process 1.0, Capture order, which writes the customer details to D3 and the order record to D1. Process 1.0 passes the order lines to 2.0, Check stock, which reserves stock in D2 for each available line. Confirmed lines go to 3.0, Take payment, which sends the card charge to the payment provider and records the result. The paid order then goes to 4.0, Fulfil and notify, which books the carrier and sends the customer their shipping notice.
The design point is the order of the steps. Stock is reserved before payment, so a failed card charge leaves held stock behind. A team adapting this should add a path that releases reserved stock when payment fails. Level 0 shows the same system as one process between the customer, the payment provider and the carrier. To adapt it, rename the processes and stores to match your system and keep each process to one job.
Click Make a copy in Google Slides, then confirm on the Google page. The copy is saved to your own Google Drive.
Rename Customer, D3 Customers, 1.0 Capture order and the other boxes to your own components, and delete the ones your system does not have.
Rewrite the 7-step data flow and the 7-row components table so they match the arrows you keep.
For the draw.io version, download data-flow-diagram.drawio and open it at app.diagrams.net.
A level 0 diagram, also called a context diagram, shows the whole system as one process with its external entities. A level 1 diagram opens that process into its main sub-processes and the data stores they use, such as 1.0 to 4.0 here.
They name data stores, which the D prefix separates from numbered processes. D1 holds orders, D2 holds products and stock, and D3 holds customer details.
External entities, such as the customer, payment provider and carrier, supply or receive data but are not controlled by the system. Drawing them outside the boundary shows which data crosses into and out of the system.
More Google Slides templatesMore developer workflows templates
Slides + PowerPoint5 slides
Free
Slides + PowerPoint5 slides
Free
Slides + PowerPoint5 slides
Free