Microservices Architecture Diagram
Slides + PowerPoint5 slides
Free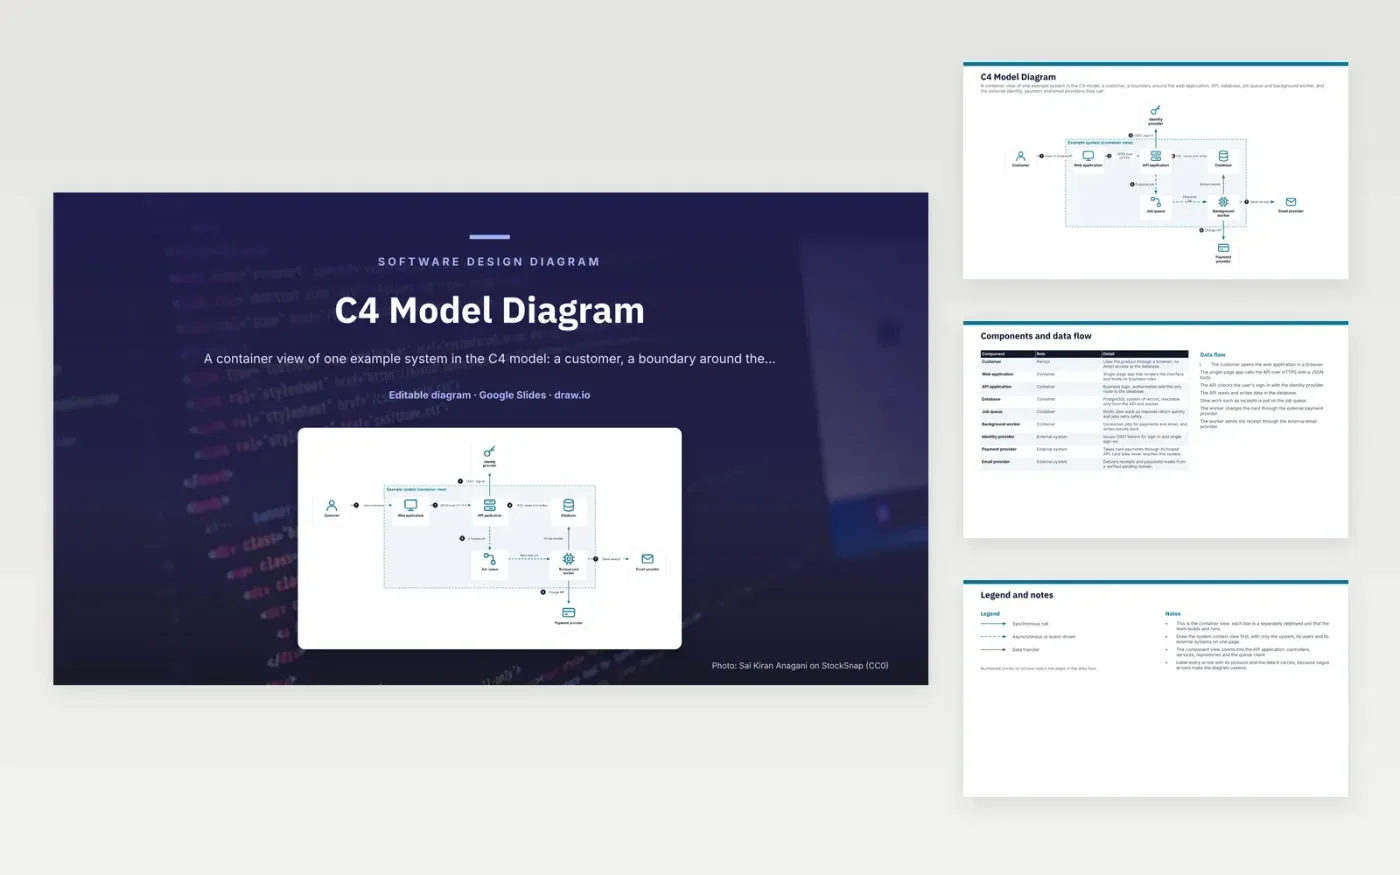
A customer opens a single-page web application in a browser. The app calls the API over HTTPS with JSON, and the API checks sign-in with an external identity provider. The API reads and writes the PostgreSQL database and puts slow work on a job queue. A background worker takes jobs from the queue, charges cards through the payment provider and sends receipts through the email provider, writing results back to the database.
Placing business rules in one API is the central choice. The API is the only route to the database, so authorisation lives in one place. The queue keeps requests fast and lets jobs retry safely when a payment or email provider is slow. Card data never reaches this system, because the payment provider's hosted API takes it. To adapt it, draw the system context view first, zoom into the API for components, and label every arrow with its protocol.
Click Make a copy in Google Slides, then confirm on the Google page. The copy is saved to your own Google Drive.
Rename Customer, Web application, API application and the other boxes inside Example system (container view) to your own components, and delete the ones your system does not have.
Rewrite the 7-step data flow and the 9-row components table so they match the arrows you keep.
For the draw.io version, download c4-model-diagram.drawio and open it at app.diagrams.net.
A container is a separately deployed unit, such as a web app, API or database. A component diagram zooms into one container and shows its internal parts, such as controllers, services and repositories.
It shows only the system, its users and its external systems on one page. That gives readers the big picture before the container detail and keeps early discussion away from internals.
A label such as JSON over HTTPS or SQL tells the reader how two parts talk and what data crosses the line. Vague arrows hide the security and failure questions a team needs to answer.
More Google Slides templatesMore developer workflows templates
Slides + PowerPoint5 slides
Free
Slides + PowerPoint5 slides
Free
Slides + PowerPoint5 slides
Free