Strategic Plan Presentation
Slides + PowerPoint14 slides
Free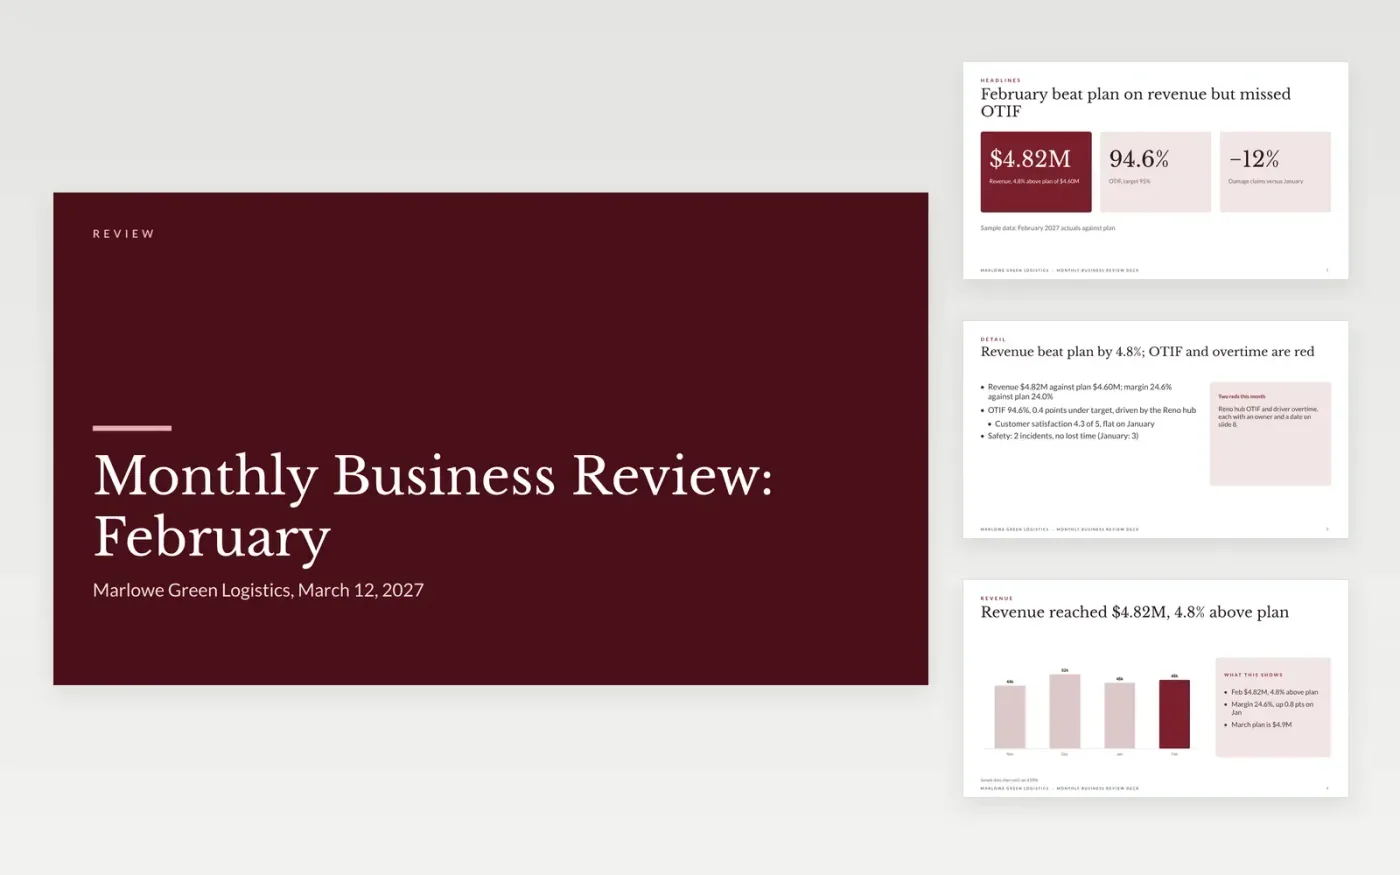
Monthly reviews go wrong when every metric gets equal weight, nothing is compared to plan and the same actions roll over with no owner. This deck puts the headline numbers first, then walks through revenue, operations, customers and people, and closes with decisions that have an owner and a date.
The sample is a February 2027 review for Marlowe Green Logistics: $4.82M revenue, 4.8% above plan, 94.6% OTIF against a 95% target, and two red items explained in one sentence each. Replace the period, figures, chart, process metrics, people and actions with your own, then delete the guide slide.
Click Make a copy in Google Slides, then confirm on the Google page. The copy is saved to your own Google Drive.
Set the period and replace the headline figures with last month's actuals against plan.
Edit the revenue chart, then keep at most three metrics per function and write one sentence of cause and one of action beside each red or amber item.
Replace the people and actions with your own owners and dates, and list the decisions you need from leadership.
Delete the Make it yours slide, then share the deck or present it.
Yes. Change the period on the cover, swap the chart to three months or four quarters, and keep the same order: headlines, revenue, operations, customers, people, actions.
No. Marlowe Green Logistics, the people and every figure are fictional and exist only to show how a clear business review reads.
Keep to three per function. The sample uses three headline figures and one process measure per stage so the red items are never lost.
More Google Slides templatesMore business operations templates
Slides + PowerPoint14 slides
Free
Docs + Word16 pages
Free
Docs + Word7 pages
Free
Slides + PowerPoint11 slides
Free
Docs + Word7 pages
Free